
Account takeover (often abbreviated as ATO) is a compromise where a user has lost control of their authentication credentials resulting in them being exposed to malicious actors. These credentials are then used to commit data theft, fraud, and other malicious activities. Email, e-commerce, financial services, and Healthcare portals are commonly targeted. ATO is particularly troublesome for service providers as they must detect the compromise, unravel legitimate activity from malicious activity, restore the account for a customer, and help the customer better protect their account going forward. It is a combination of investigation and customer support at a frustrating and risky moment in time.
We have seen recent examples of this in several high profile data breaches related to infostealer malware. Additionally Cisco TALOS recently warns of a spike in credential stuffing using anonymizing services.
Multi-factor Authentication is a good control and commonly implemented to prevent valid credentials from successfully authenticating. However, multiple techniques have been used to bypass MFA, including Social Engineering, SIM Swapping, OTP Brute forcing, and push notification spamming. Continuing credential compromise related breaches demonstrates that MFA has not completely mitigated the threat of ATO.
This article will explore how to enrich authentication logs and train a machine learning algorithm on what a “normal” authentication should look like. From there we can compare subsequent authentication and look for deviations from the calculated norm. We will code methods that attempt to show why the authentication is identified as anomalous. Through data collection, feature selection, and tuning we will produce actionable detections that can be used to limit the impact of account takeover.
Authentication Data Collection
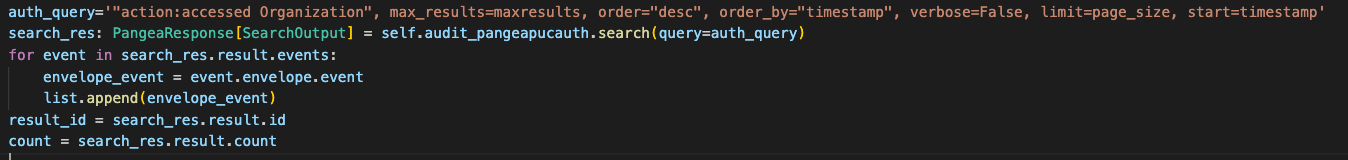
Our first step is to gather account authentication information for systems that can be victim to account takeover attacks. It is security best practice that all systems that service authentication record the event to a secure log. See the Pangea Secure by Design education hub for logging strategies and guidance. For the purposes of this article, we have an archive of real authentication logs stored in an instance of our Pangea Audit log. The data is a mix of small business, industry professionals, and corporate use. This code uses our Python SDK to query an Pangea Audit and build an object:
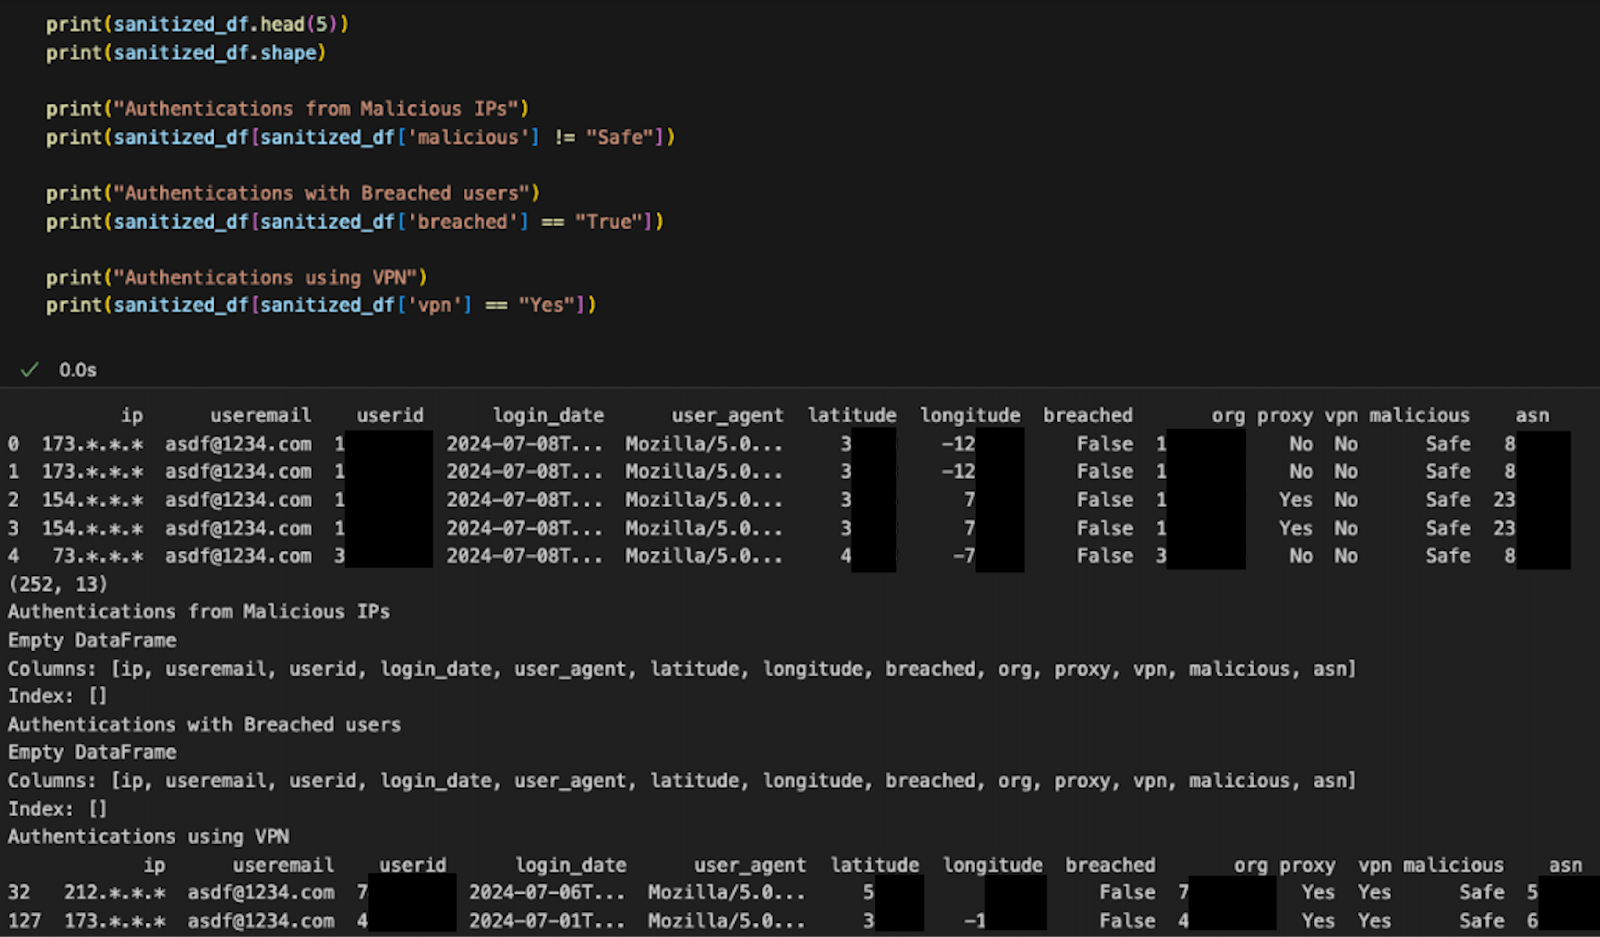
Here we will convert the data into a pandas data frame, sanitize the data, and display it

The next task is to identify key fields in our application logs. Interesting fields included IP address, timestamp, organization id, and user id.
While seemingly random, an IP address can give a lot of context about the user logging in. IPs can be traced back to the geographic location they are likely to be used from. Geo-ip services attempt to correlate an IP to a geographic location using a variety of public and proprietary techniques. Also intel services can report if an IP has been identified as a proxy server or a VPN. Proxy servers and VPNs are tools attackers use to hide their real IP address. Additional and powerful indicators are services that can report if an IP has been associated with malicious activity.
What is known as an ASN identifies a collection of IPs owned by an organization, so it is possible to look up what organization an IP is owned by. It would be reasonable to assume an organization’s users come from predictable ASNs. For instance, a population of ASNs associated with consumer broadband services, cellular networks, or ASNs used by your corporate customer network providers.
This example shows Using Pangea IP and Domain Intel services to access up-to-date IP relevant data. Code to look up the IP information such as Geo-ip, identify if the IP is a proxy or VPN, and determine if the IP has been associated with malicious activity in the past is shown.

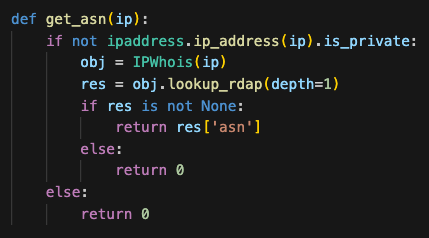
ASN information can be gathered through the IPWhois python module.
Next, since our authentication log includes an email address, a user breach lookup can be performed. The breach data contains information from dark web markets and exposed breach datasets. Alongside other indicators, flagging a user as breached may enhance the likelihood an authentication is malicious.

Finally features can be generated from the authentication timestamp and the browser user agent. Most authentication systems go through predictable bell curves with regards to the time of day login events occur. For instance, a service could have a spike of authentications when users first log in for the day, then tapering down through the normal working hours, and finally trailing off when people go home. Even with global services those bell curves can be teased out if filtered by geo-ip. We may be able to assume normal users like to keep business hours or sleep during regular times. Similar assumptions can be made about the day of week.
User agents are passed by the browser when http requests are made and contain browser and OS details. It is likely user populations are concentrated to a few similar operating systems and browsers. It is also common for credential stuffing attacks to use automated scripts. User agents passed by these scripts may be non-existent, old, or actually include the fact that they are an automated scripting tool.
To perform this work and some cleanup we are going to convert our log object to a Pandas dataframe. A label encoder will be used to convert strings like OS and Browser to numeric values. This will be important later as we use machine learning algorithms.

Data Analysis
It is now possible to identify single suspicious logins with the malicious IP data. While this signal may have false positives and absolutely will have false negatives, it can provide threat hunters an indicator to manually follow-up on.
The code to find events based on user breach data, VPN, and malicious IP data could look something like this:
These results are useful, but do not put events into context or use the full array of information we have been able to gather. It’s important to remember that customers will have different - but still legitimate - usage patterns. For example:
Customer A is a business behind a VPN. Normally, users will be authenticating from work laptops that use this vpn. However, at times after hours work is performed by individuals from a few geographic locations that correspond to regional offices.
Customer B is fully remote, however due to compliance requirements all individuals are within a specific country. Corporate policy prohibits use of unsanctioned proxy services.
A manual profile of each customer could be created and rules applied to find exceptions. While this can work on a small scale for experiments, it is time consuming and would require constant maintenance as customers change their usage patterns.
Fortunately, we have numerous machine learning tools to move quickly and at scale.
Analyzing Threat Data with Machine Learning
Mature machine learning libraries are available to analyze our data. There are many different techniques, with trade offs such as performance, accuracy, and the type of data they work well with. Here we will use an IsolationForrest model available through the scikit-learn Python module.
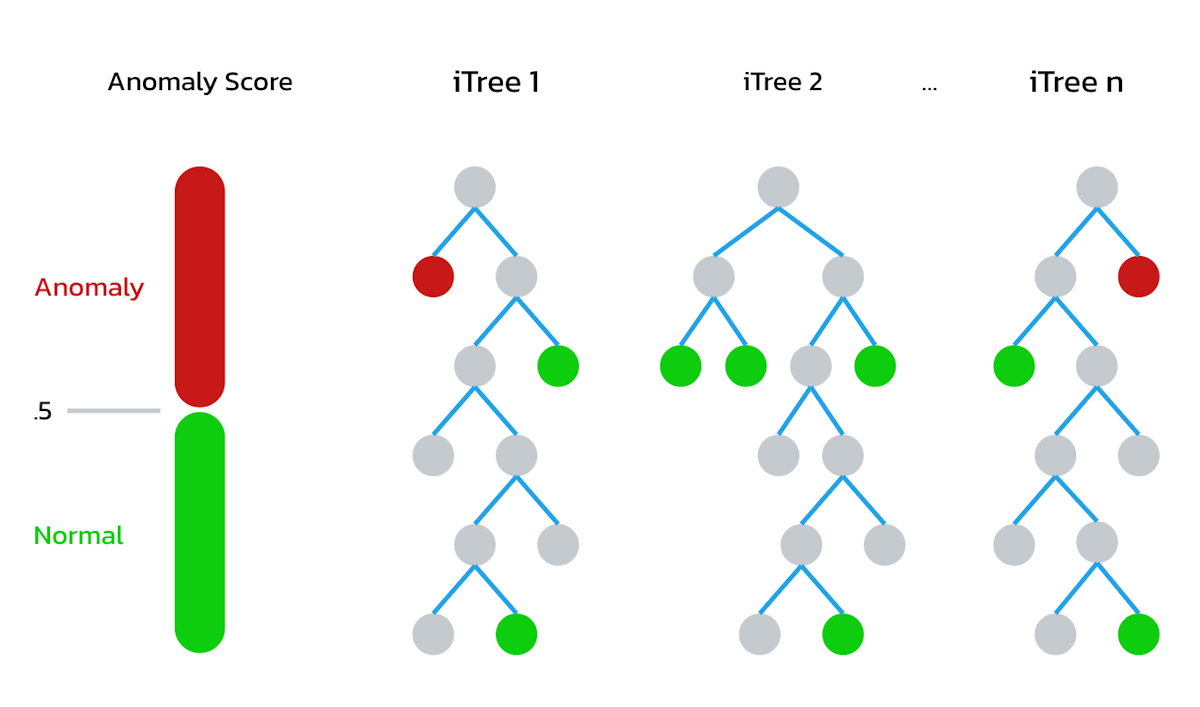
The Isolation forest algorithm uses a “forest” of binary trees to estimate anomalies found within the selected features. The idea is that anomalies in data are unique and rare while normal data is common and frequent. They will be quicker to find because they are higher in the tree. A shorter path length between the root to a leaf of the binary tree suggests an anomaly. This graphic gives a conceptual idea of how they work:
The first step is to extract features from our enriched log data. Like mentioned before, features should be numeric and scaled into something that is appropriate for our algorithm.
Features we chose:
IP address: Convert this to a numeric by calculating the sum of the first three octets
User id: Calculate a numeric hash from the log’s user ID field.
Malicious IP detection: 1 for true, 0 for false
Proxy IP detection: 1 for true, 0 for false
VPN IP detection: 1 for true, 0 for false
IP ASN number: already an integer tied to an owner
Latitude: already a number
Longitude: already a number
User breach: 1 for true, 0 for false
Login Date Hour: calculate the hour the login event occurred.
Login date day: Calculate the day of the week the login event occurred.
User agent Browser: use the user_agents module to extract browser data
User agent browser version: use the user_agents module to extract browser version
User agent OS: use the user_agents module to extract the OS
User agent OS version: use the user_agents module to extract the OS version
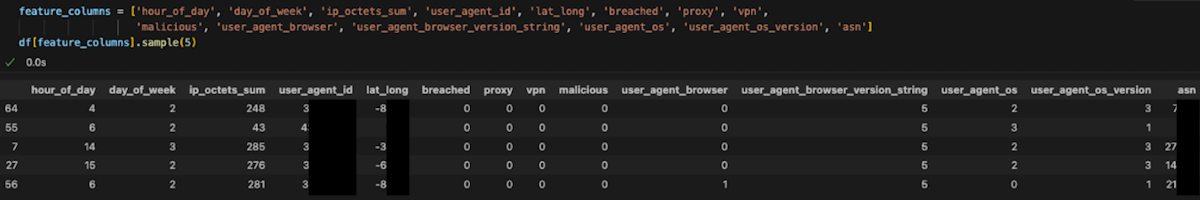
The data looks like the below:
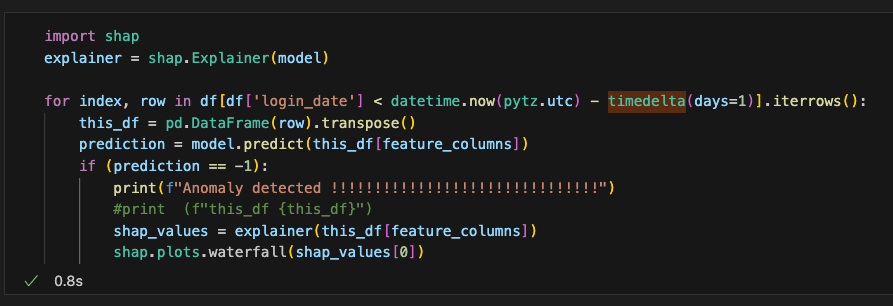
With features chosen a model can be built in just a few lines of code. Model Data will be everything before the current time minus one day. Note that contamination is set to .01. This means there is already 1% of the data that should be ignored as it is an outlier for one reason or another. Tuning this value can help with overfitting and false positives.

A model is now built that includes historical authentication information. Comparing this to the last 24 hours of data may now result in discovering outliers in authentication events. We also include output from a module called shap. This plots the features that contributed to the data prediction decision.
An example finding is below
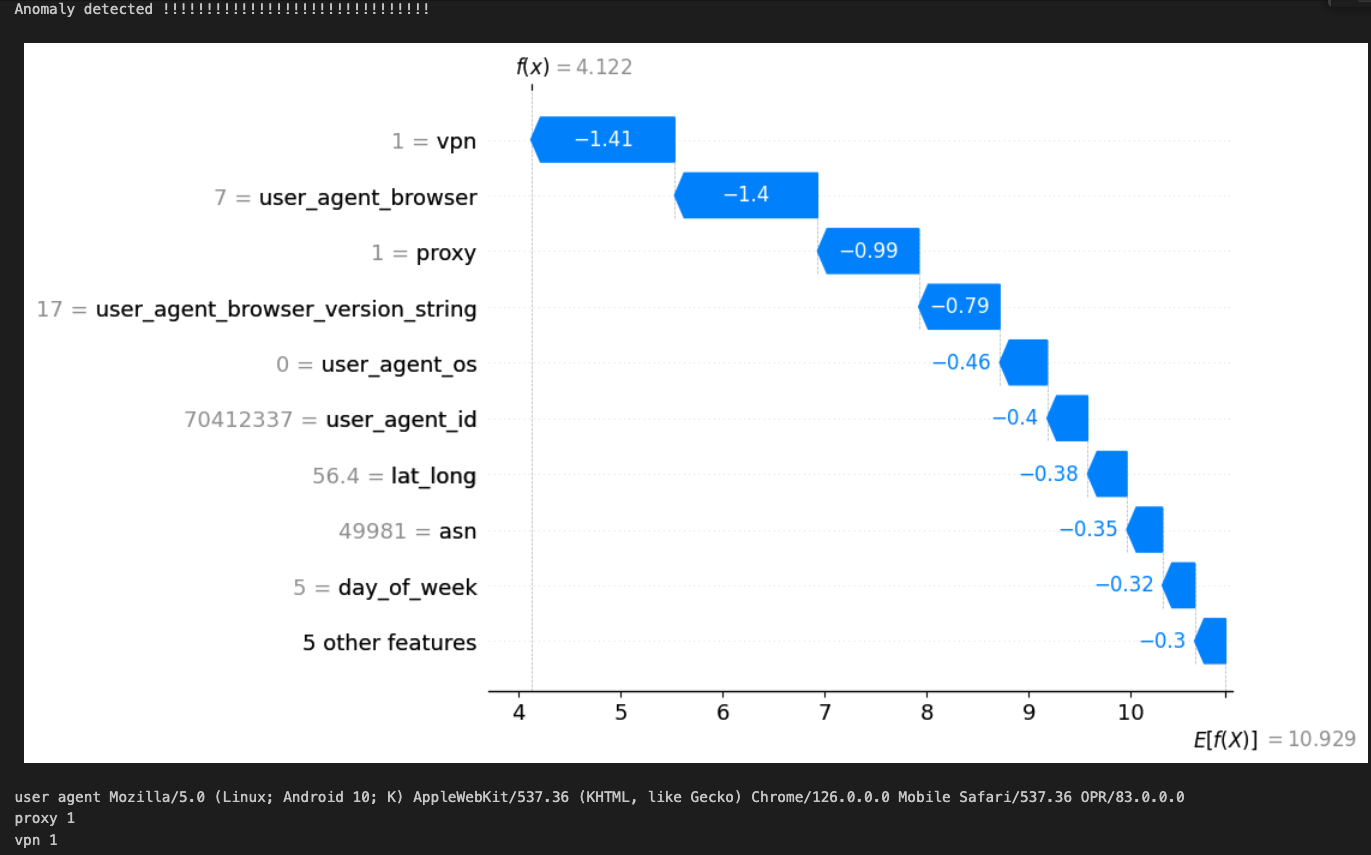
In this example outlier finding we see several anomalous features. The primary contributing feature is the authenticating IP has been flagged as a vpn. Second, there are several elements of the browser user agent that appear odd. Looking at it the OS is Android with an odd version string; The browser appears to be Opera with an odd versions string; 83.0.0.0 vs something like 83.1.2.3.
This authentication event may be something worth looking into. Compared to normal user traffic this is indeed anomalous.
Tuning:
The machine learning model can be tuned to increase the quality of outliers detected and limit false positives. Experimentation with different combinations of features is often useful. More features are not always better. Also feature scaling techniques can help to make them more actionable to the machine learning models.
Domain expertise is important to feature selection. We previously discussed building features from the time of day and day of week. However, your data may be time insensitive. For instance if the authentication was performed by 24/7 security guards, generating features from time would not add useful data. Similarly, if your customer base consists of corporate users that are often behind corporate Proxy servers you may want to drop the proxy feature.
Your model is only as good as the data it receives. Care should be taken to not overfit the model. For instance, if the data includes active credential stuffing attacks subsequent events will appear normal and not be flagged as an outlier. Efforts to filter out this known anomalous data will improve output. Additionally models can contain values that assume some of the data is already anomalous, such as the “contamination” value of the Isolation Forest algorithm.
Once a stable baseline has been tuned, the resulting events can be migrated into actionable security alerts.
Conclusion:
Operational security often involves analyzing large amounts of data and finding things that are anomalous. Many times alerting rules look at previous knowledge to define potentially malicious activities. Using existing data to model expected behavior and alerting on events that don’t match that baseline can proactively detect the unknown.
Account takeover has caused significant loss to businesses and their customers. Using your existing logs, Pangea APIs for enrichment, and some fairly basic and approachable machine learning techniques, we can detect and limit the impact of credential theft.
Example code can be found at https://github.com/pangeacyber/AccountTakeoverML