
Rob Truesdell
VP, Products
Product Updates - Sep 15, 2023
File Scan
Beta availability
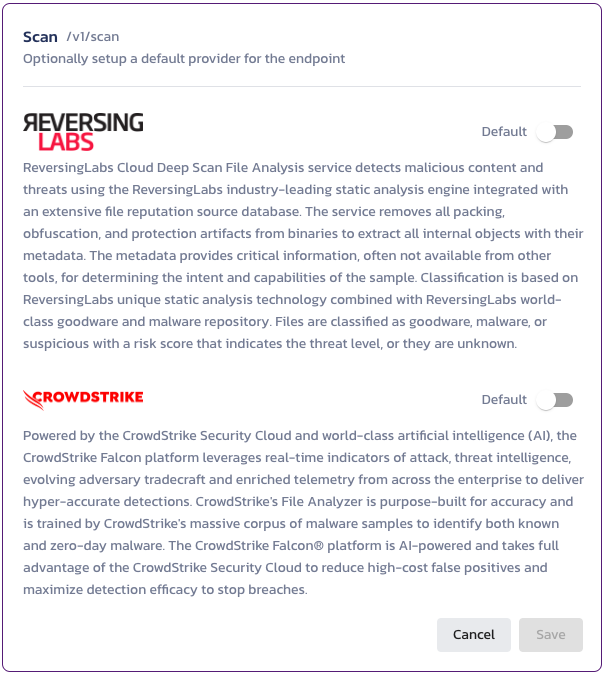
The File Scan service allows a user to upload file objects and execute a malware scan using either CrowdStrike or ReversingLabs as the provider. File scanning is different from File Intel in that scanning uses static analysis engines against the file object to determine the intent and capabilities of that file object, whereas File Intel can only tell you the reputation of a previously known file. Scan time varies depending on the object size and complexity, however this is a more comprehensive and sophisticated method of uncovering malware.
Secure Audit Log
Audit Log Forwarding to Splunk
The Secure Audit Logging service can now forward logs to Splunk, allowing users to support other observability or security use cases. Splunk is the first supported destination with more external data stores to be supported in the future (connect with our support) to let us know which external data store you would like supported). Audit log forwarding can be configured in the Settings section of the Secure Audit Log service page in the Pangea console.
Redact
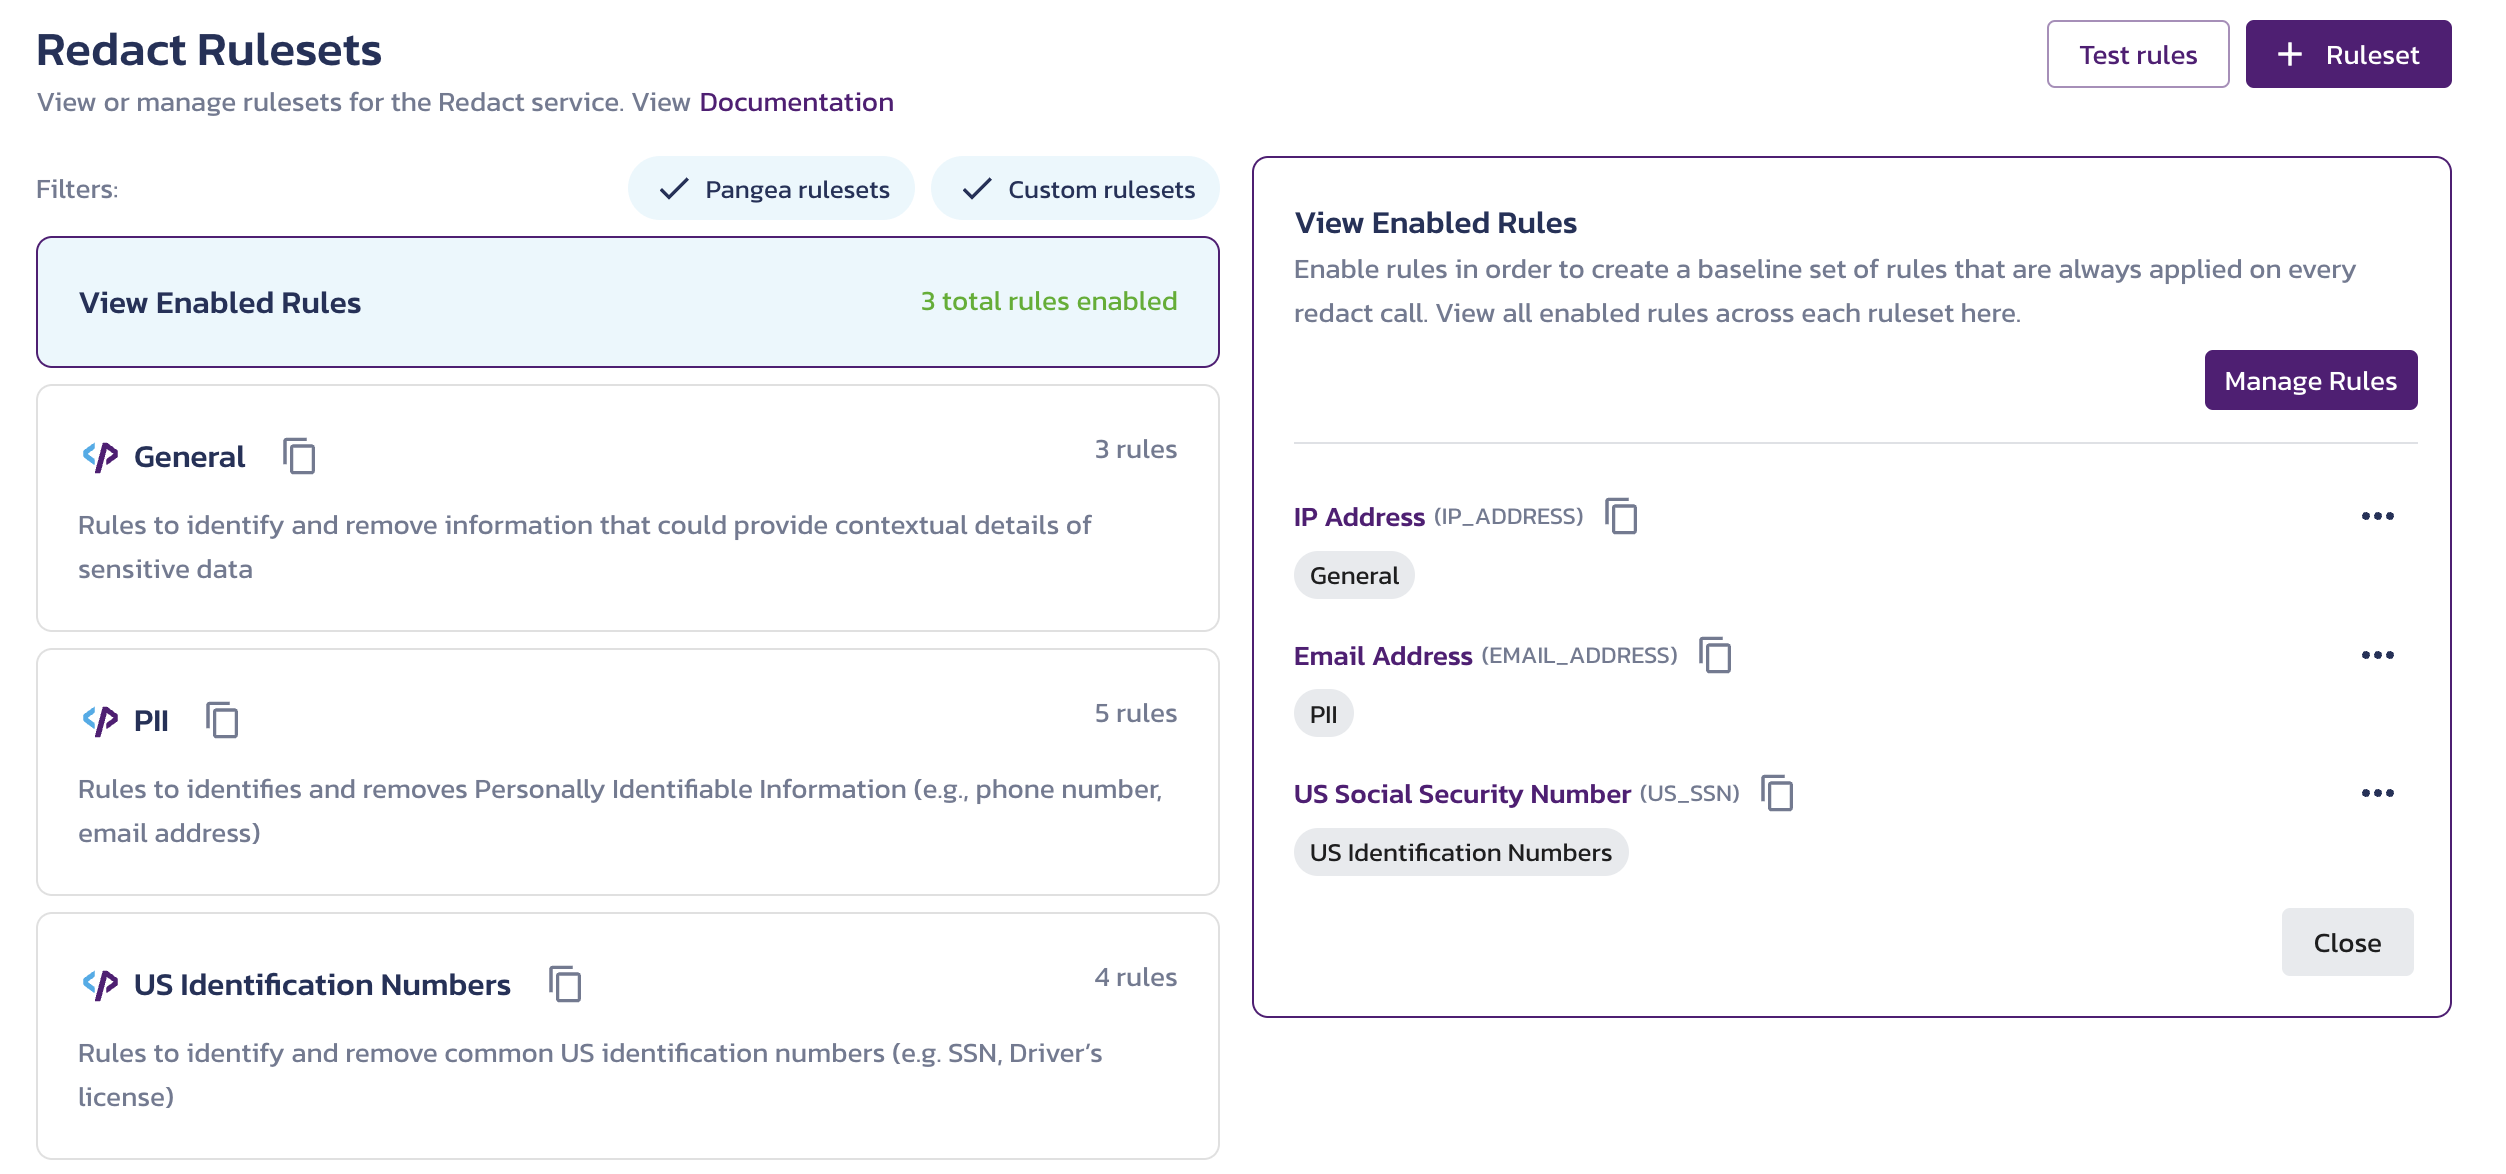
Revamped Rulesets Interface
The Redact ruleset interface now allows you to easily view which of your rules are enabled. The top of the main ruleset column now has a ‘View Enabled Rules’ view that will display the enabled rules on the right hand side. This makes it easier to have an overall view of enabled rules without having to expand each individual ruleset.
Updated Redact API behavior
When using the optional input parameters rules or rulesets in the Redact API, it’s important to know that any rules or rulesets specified are incrementally applied to the ruleset(s) enabled via the Rulesets page in the Redact configuration console. Specifying a rule or ruleset in the API parameter does not replace the ruleset configured via the console but adds to it. The configuration in the console is a baseline configuration that will always be applied.
Console Updates
New Service Enablement Flow
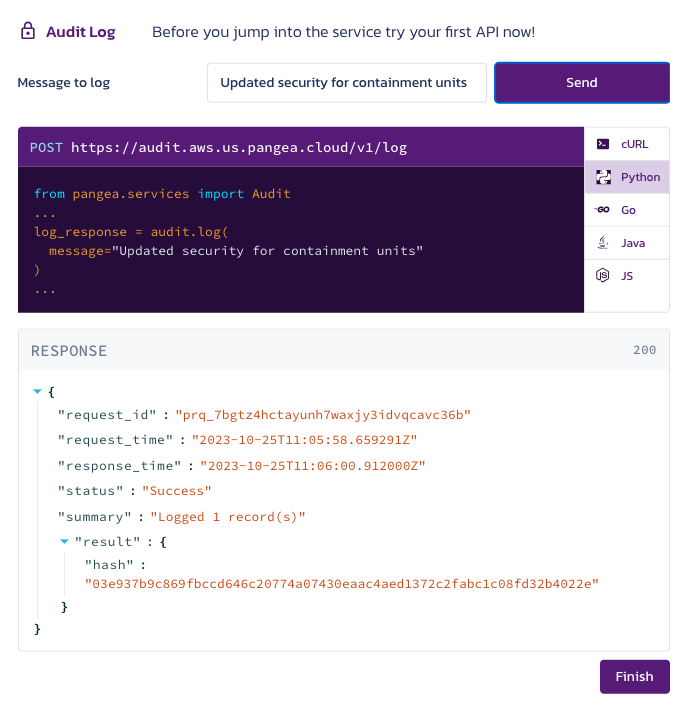
At the end of each service enablement flow, there is now an interactive API execution screen that demonstrates how the API works and gets you executing your first API in the service more quickly. You can change the input parameters to the API, as well as choose the programming language to see what the syntax looks like in the various SDKs that are supported.
Updated Token Creation Flow
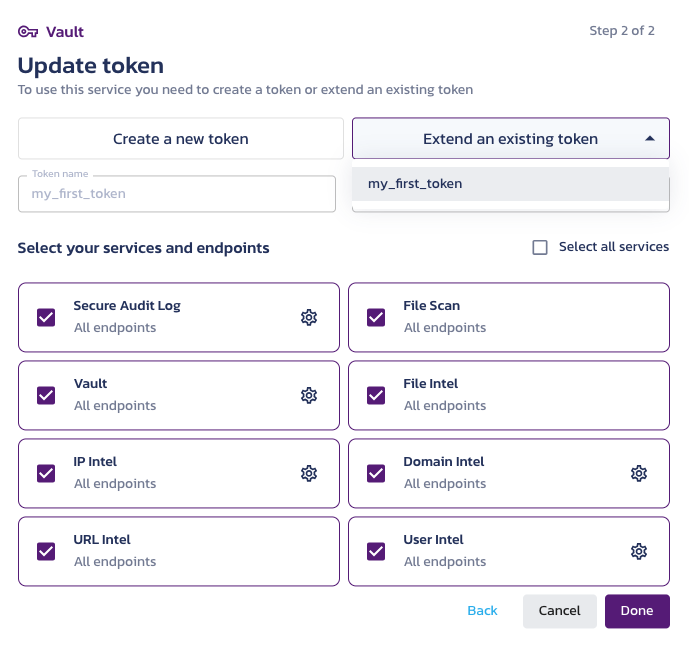
When configuring a new service the token creation flow has been updated to make the overall experience of either creating a new token or extending an existing token more clear.
Improved Error Reporting
Now there is a detailed error drill down console. This uses the same audit log viewer functionality available in the Secure Audit Log service, with search and filtering built in. The error console provides information about errors related to the selected project's product usage. You can access this error reporting page by clicking on 'Errors' within the 'Average daily events' dashboard widget on any service page.
Documentation Updates
SDK Syntax in API Sample Execution Playground
Similar to the service enablement flow, the execution playground that is available for every API endpoint now has a programming language selector so that you can see the syntax for that particular call in any of our supported SDK languages: REST, Node.js, Java, C#, Python, Go.
If you have questions, don't hesitate to contact our support. Our engineering team are available online to respond to your inquiries.