Browser Sensors
To begin monitoring browser-based AI activity, register a Browser sensor in the AIDR console.
Chrome Extension
The AIDR Browser Sensor is a Chrome extension that detects AI activity in managed browsers and enforces content policies on outbound requests to AI providers like ChatGPT, Claude, and Gemini.
Register sensor
-
In the left sidebar, click + Sensor (or + if you are on the Visibility page) to register a new sensor.
- Choose Browser as the sensor type, then select the Chrome option and click Next.
-
On the Add a Sensor screen, enter a descriptive name and optionally assign input and output policies:
- Sensor Name - A label that will appear in dashboards and reports.
- Input Policy (optional) - A policy applied to incoming data (for example,
Chat Input). - Output Policy (optional) - A policy applied to model responses (for example,
Chat Output).
By specifying an AIDR policy, you choose which detections to run on the data sent to AIDR, making results available for analysis, alerting, and integration with enforcement points. Policies can detect malicious activity, sensitive data exposure, topic violations, and other AI-specific risks. You can use existing policies or create new ones on the Policies page.
If you select
No Policy, Log Only, AIDR will record activity for visibility and analysis without applying security rules in the traffic path.
-
In the Sites section, specify how policies are applied to different AI provider domains:
- Use Policy - Full enforcement; detections trigger actions defined in the policy.
- Report Only - Detections are logged but not enforced.
- Disabled - Policies are not applied to that site.
-
Click Save to complete sensor registration.
Deploy sensor
To deploy the Browser Sensor, follow the instructions provided in the Install tab based on your environment. Currently, the sensor supports three deployment methods:
- Self-Service - Install the Chrome extension and apply a configuration profile on your machine.
- JAMF - Use a Mobile Device Management (MDM) solution to deploy the Chrome extension and configuration profile across managed devices.
- Chrome Enterprise - Deploy the sensor at scale using Chrome Enterprise policies for managed devices.
Test sensor using Self-Service
You can quickly evaluate the Chrome Browser Sensor on your own device before deploying it at scale. The Self-Service method installs the Chrome extension locally and applies a configuration profile with your sensor credentials.
Install sensor locally
-
Install the Chrome extension
Use the installation link shown in the AIDR console.
-
Download the configuration profile
- macOS – download the
.mobileconfigprofile. - Windows – download the
.regpolicy file.
This file contains the client ID and secret from your sensor’s Config page and authenticates the extension with the AIDR platform.
Example AIDR profile for macOS<?xml version="1.0" encoding="UTF-8"?>
<!DOCTYPE plist PUBLIC "-//Apple//DTD PLIST 1.0//EN" "http://www.apple.com/DTDs/PropertyList-1.0.dtd">
<plist version="1.0">
<dict>
<key>PayloadContent</key>
<array>
<dict>
...
<string>https://{SERVICE_NAME}.aws.us.pangea.cloud</string>
<key>clientId</key>
<string>psa_4vxqsg...f73cdcx</string>
<key>clientSecret</key>
<string>pck_l6azvf...5qbz5q</string>
...
</dict>
</array>
...
<string>Pangea AIDR Chrome Extension Settings</string>
</dict>
</plist> - macOS – download the
-
Apply the configuration
- macOS – double-click the downloaded profile, then activate it in System Settings > Privacy & Security > Profiles.
- Windows – double-click the
.regfile to merge it into the Registry. Confirm the prompts, then restart Chrome so the new settings take effect.
-
Verify detections
Visit a supported AI provider (for example,
chat.openai.comorclaude.ai) and interact with the LLM. Detection results will appear in the Findings and Visibility tabs in the AIDR console.
Troubleshoot with Chrome DevTools
You can confirm the extension is working and sending data to AIDR:
- Open
chrome://extensions/and enable Developer mode. - Click Details for the Pangea AIDR extension.
- Under Inspect views, click the service_worker link.
- In the DevTools Network tab, filter by XHR.
- Interact with a supported AI provider and watch for outbound requests to the AIDR APIs.
Chrome Enterprise
To deploy the AIDR Browser Sensor at scale, use Chrome Enterprise Cloud Management. This approach allows centralized installation and configuration across managed Chrome browsers in your organization.
-
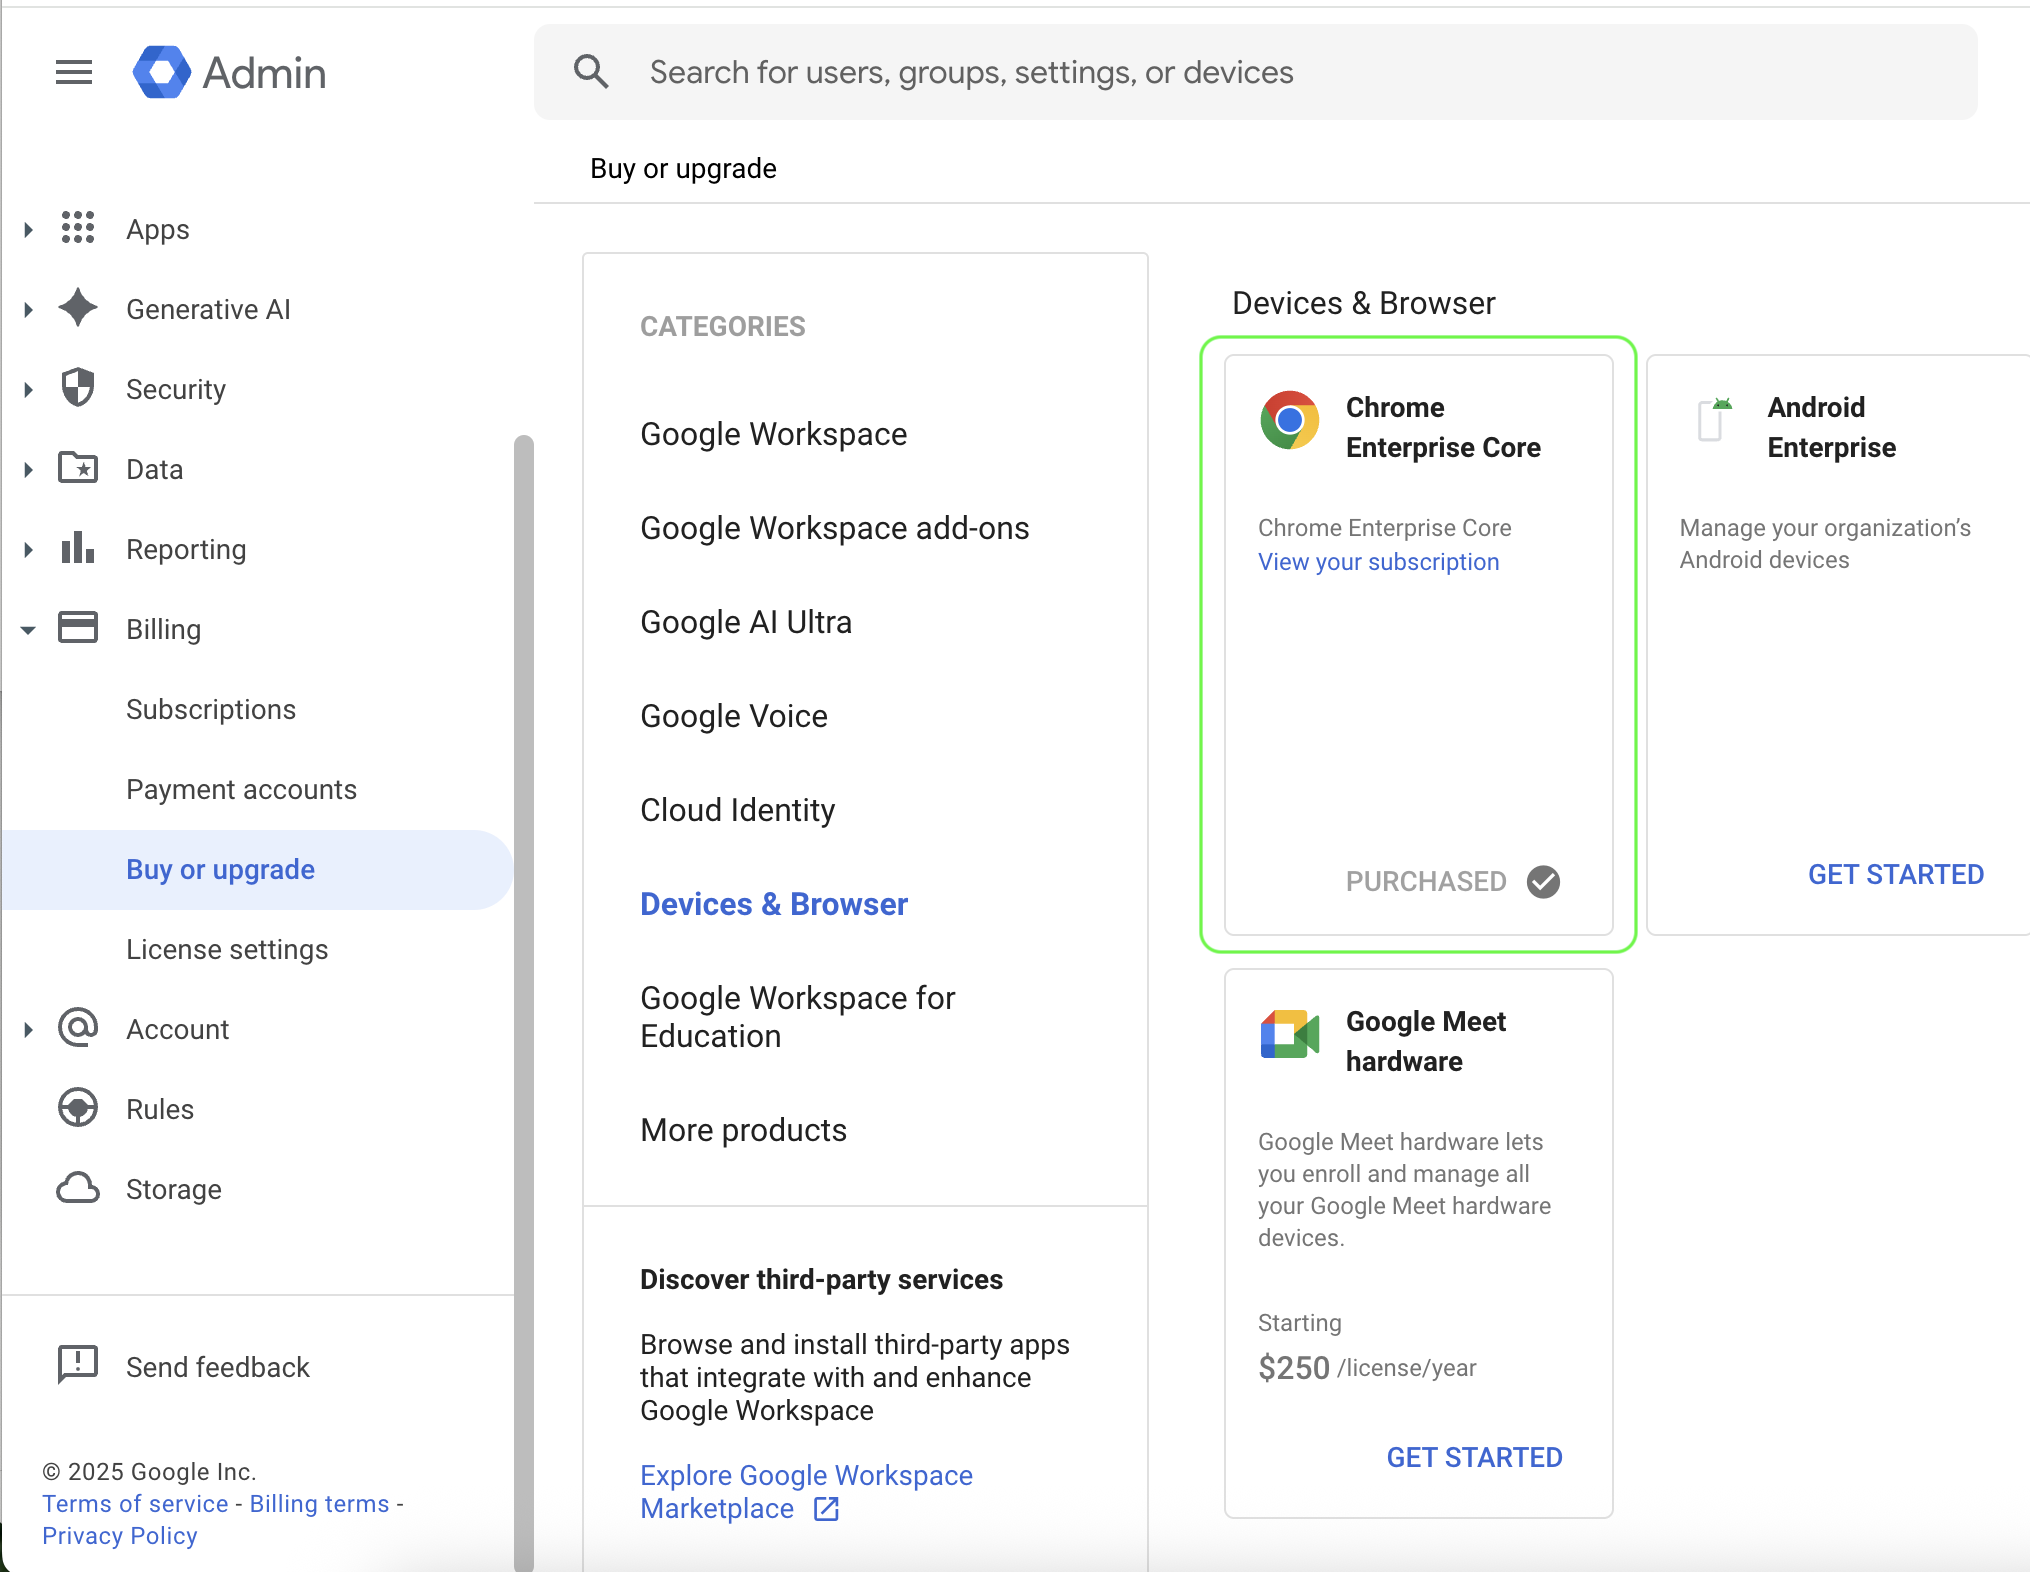
In your Google Admin console, follow the Set up Chrome Enterprise Core instructions to activate your subscription.
-
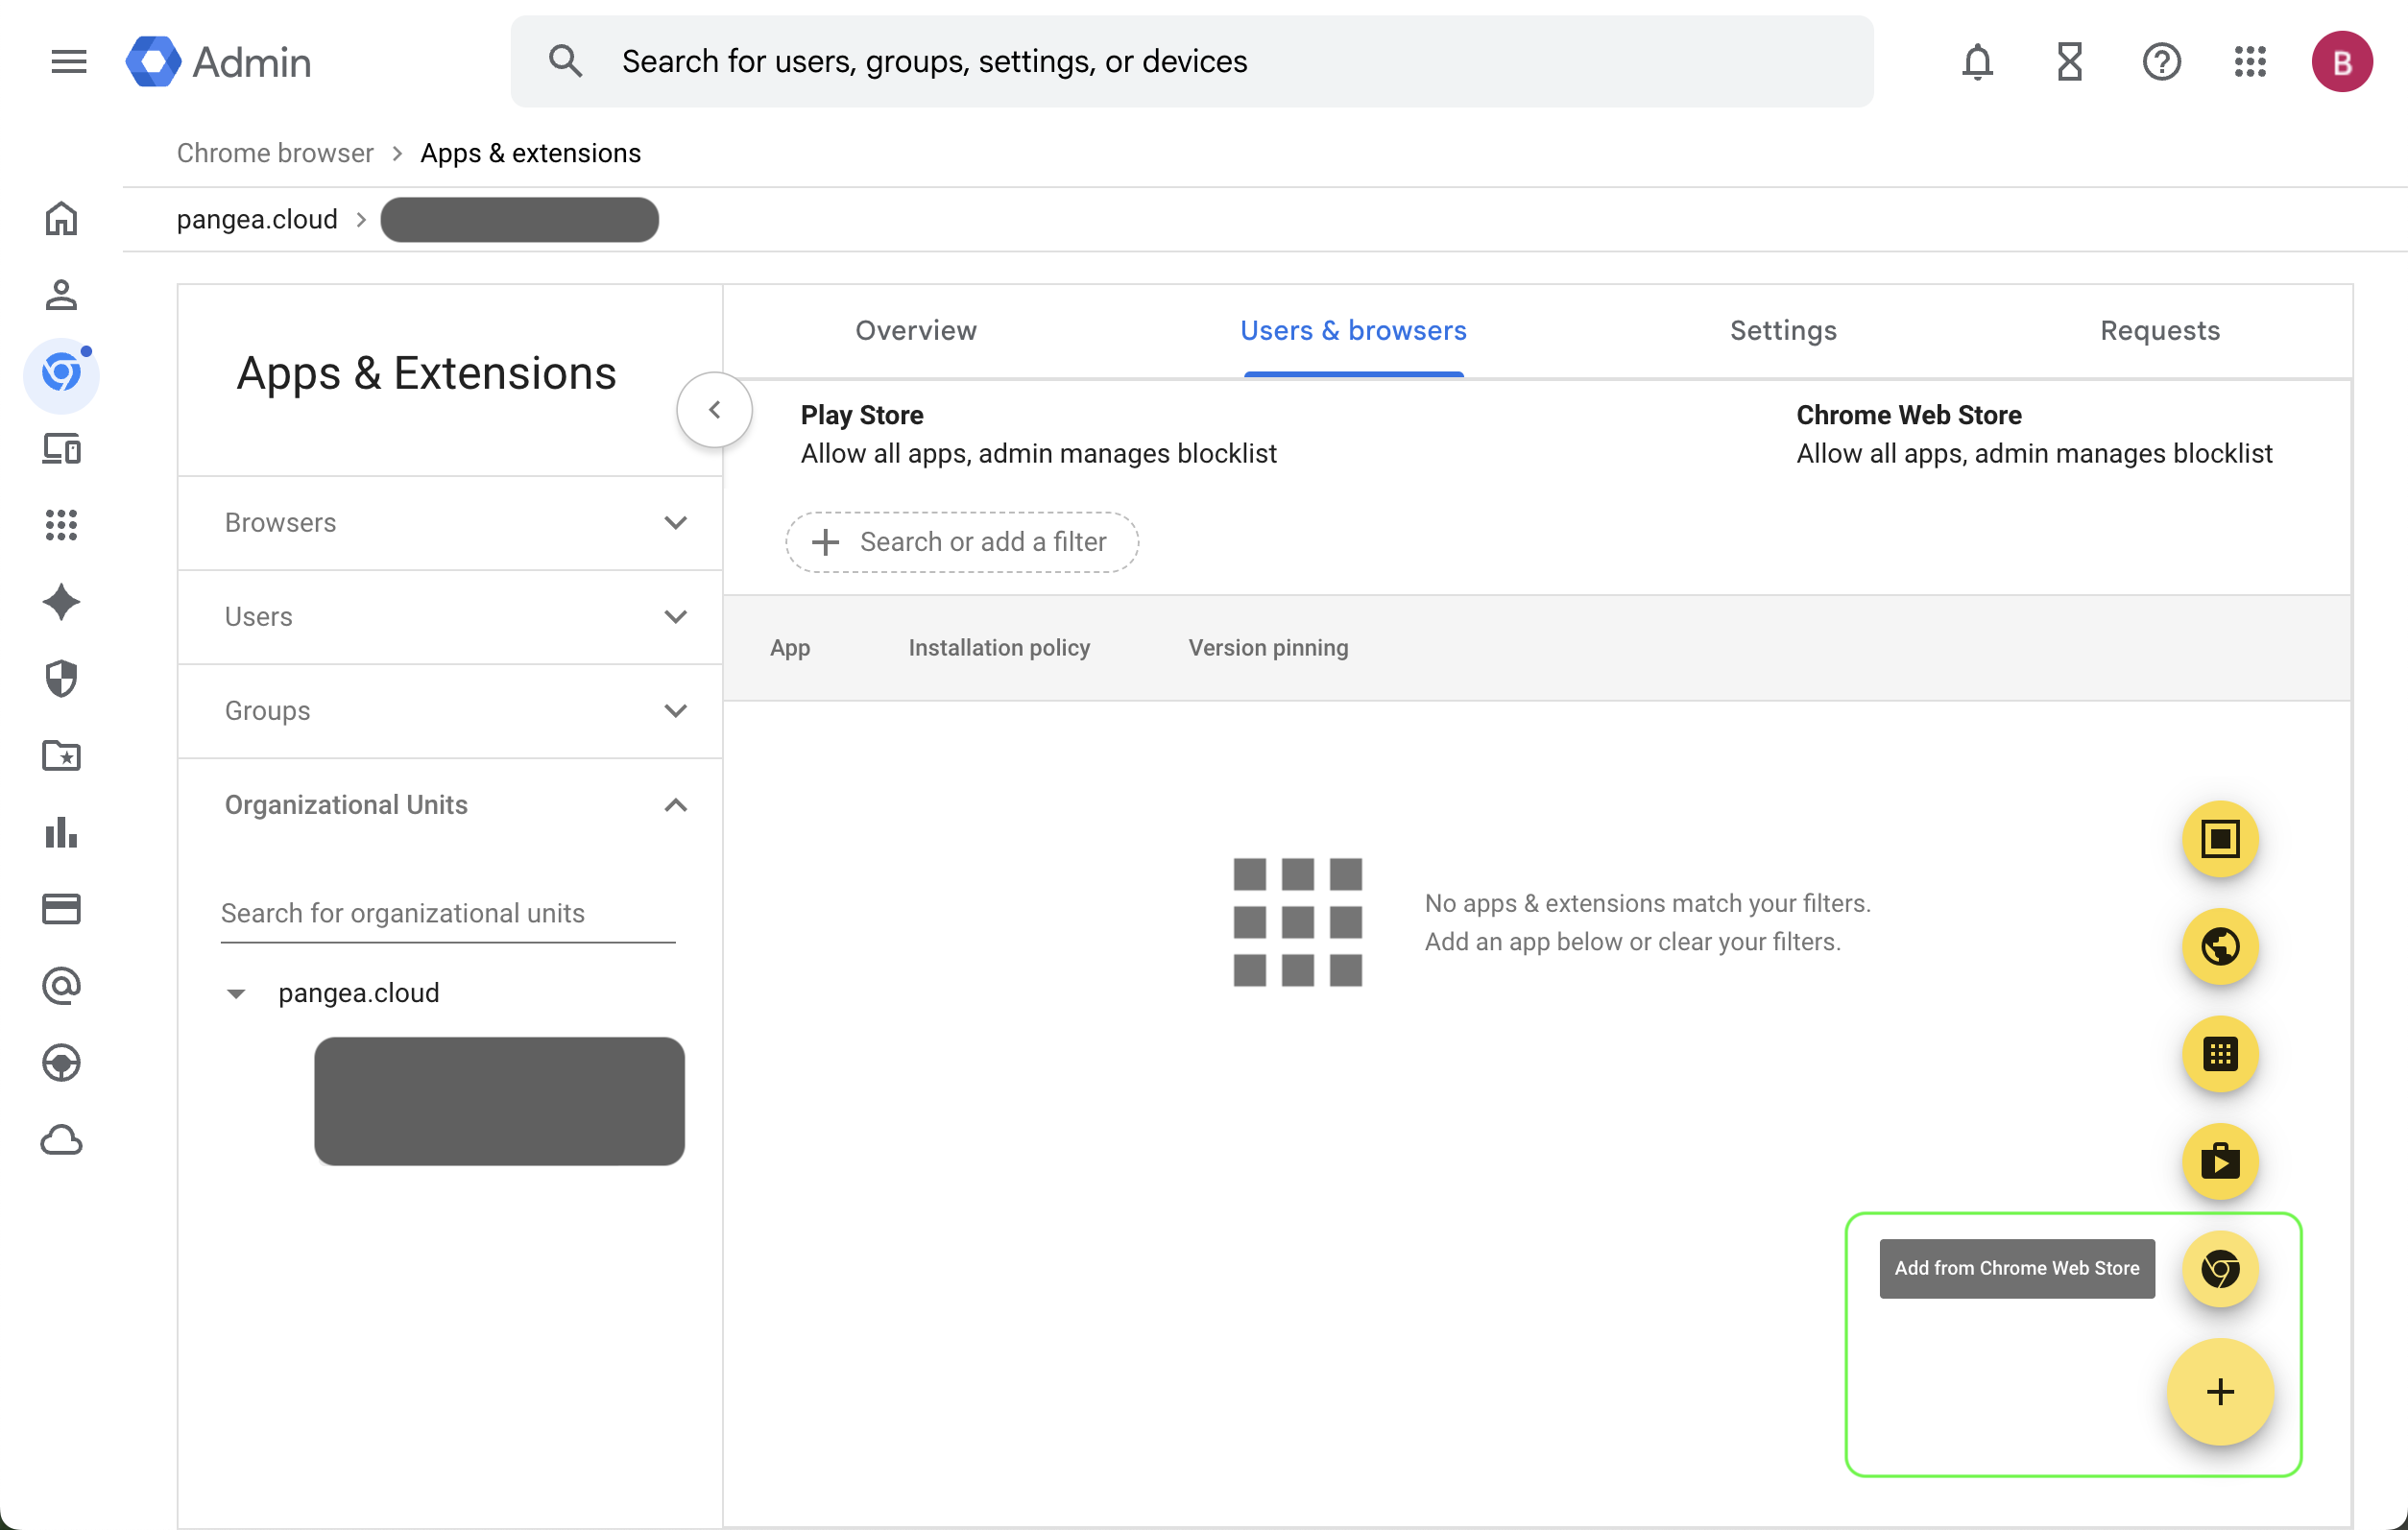
In the Google Admin console, click the menu icon and navigate to Devices > Chrome browser > Apps & extensions and add the AIDR Chrome browser extension. For example:
-
Select or create an Organizational Unit (OU).
-
Click the Users & browsers tab.
-
Hover over the + icon and choose Add from Chrome Web Store.
-
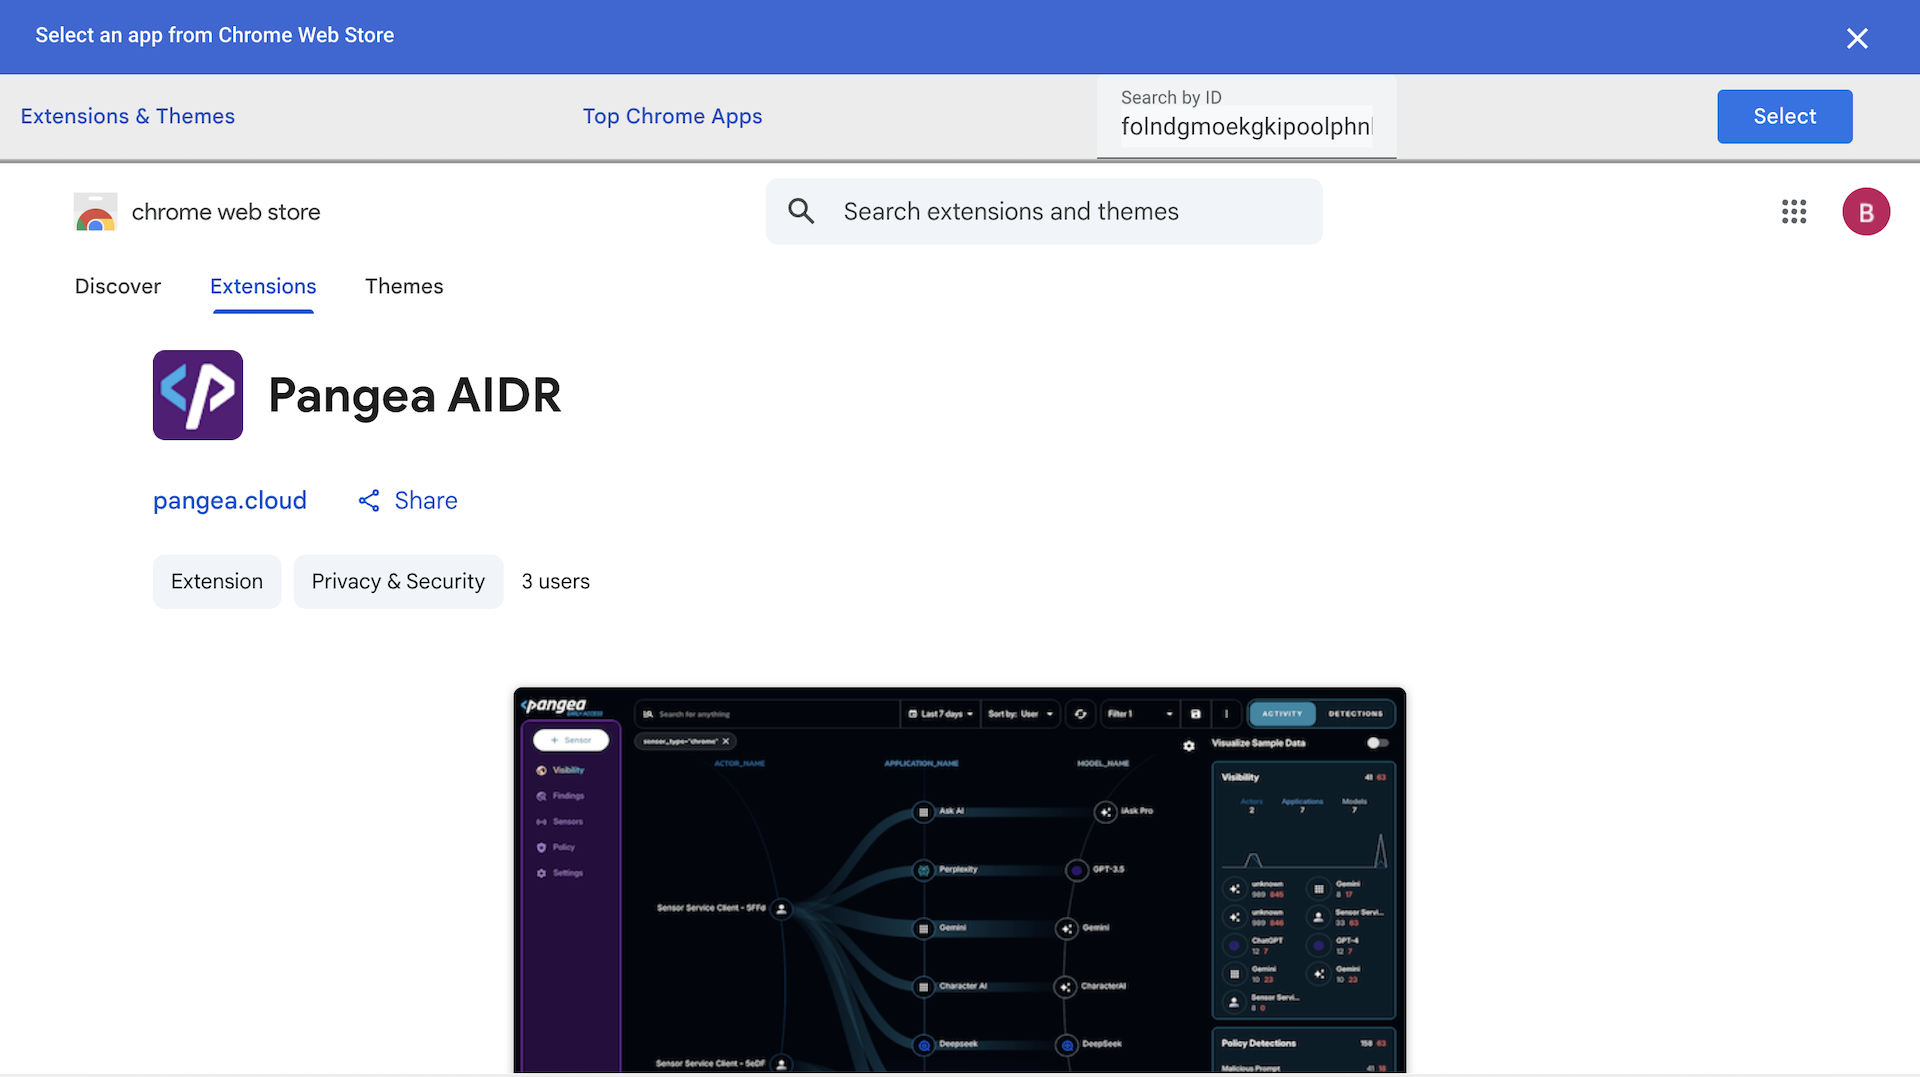
Search for the Pangea AIDR extension using the Extension ID shown on the Install tab in your AIDR console.
-
Add the extension to the selected OU.
-
-
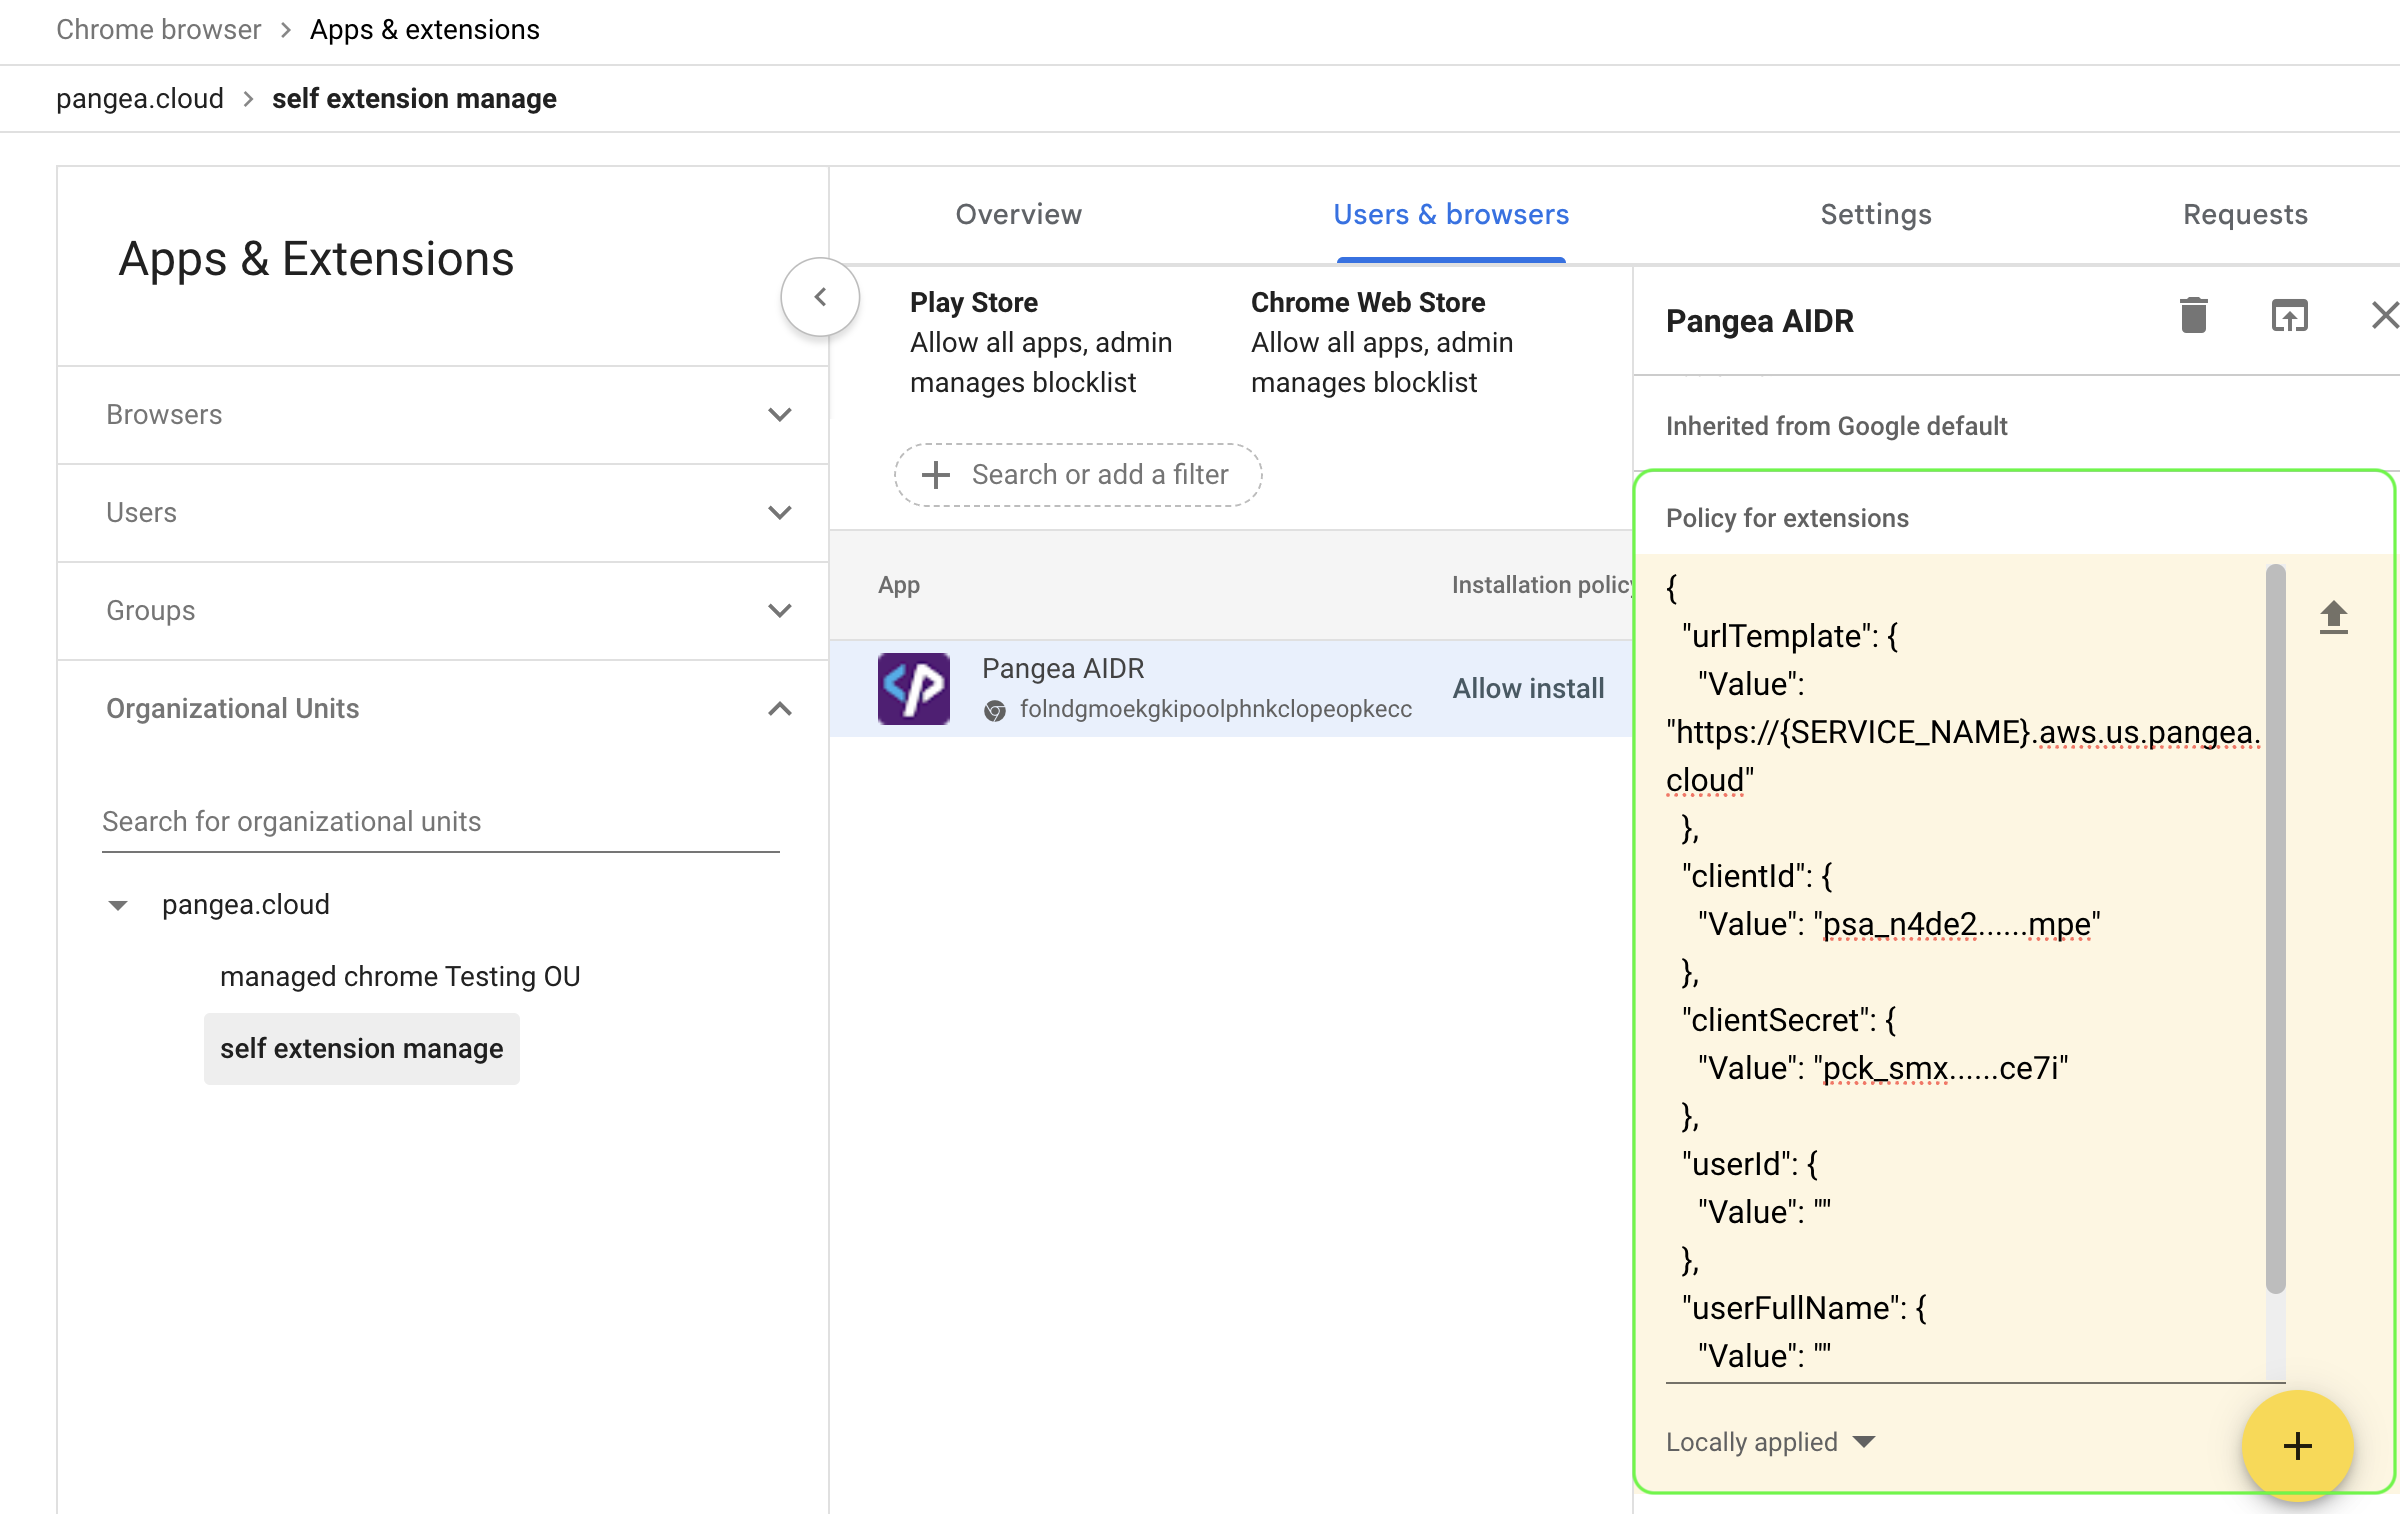
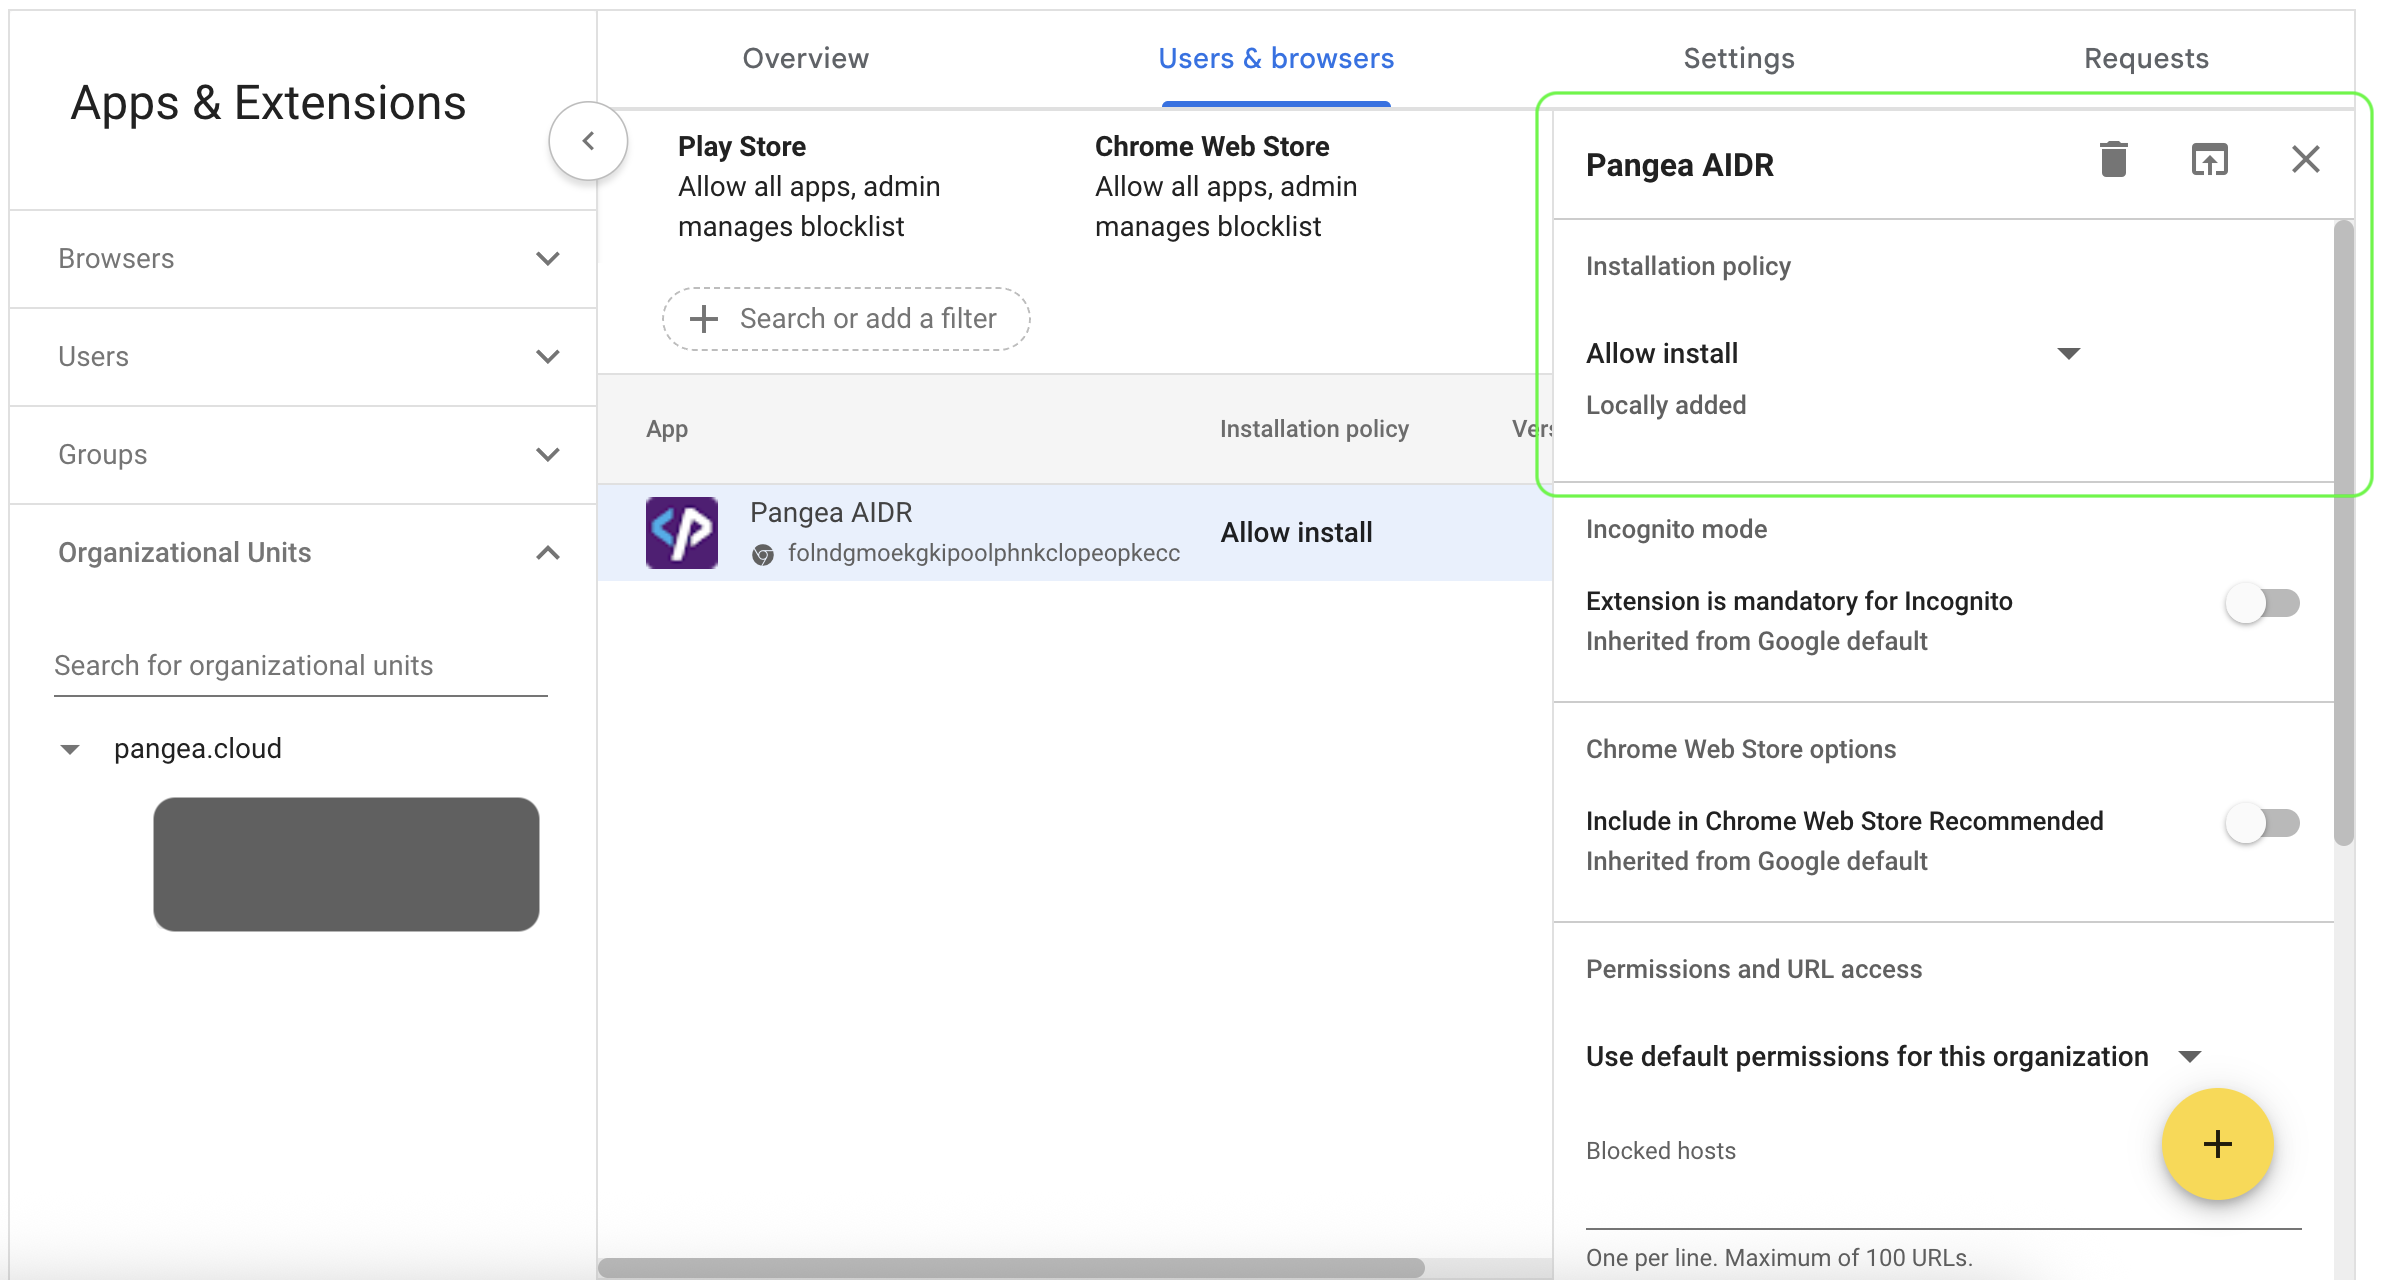
Select the added extension. Under Policy for extensions, paste the Extension Policy JSON copied from the Install tab in your AIDR console.
This policy configures the extension with the required credentials and ensures it can communicate with the AIDR APIs for telemetry and enforcement. When you use the Copy button, the JSON is automatically populated with the correct client secret from your sensor registration.
-
Select an Installation policy.
For example, choose Force install + pin to browser toolbar to automatically deploy the extension to all users in the OU and pin it for increased visibility and user awareness.
-
Save your changes.
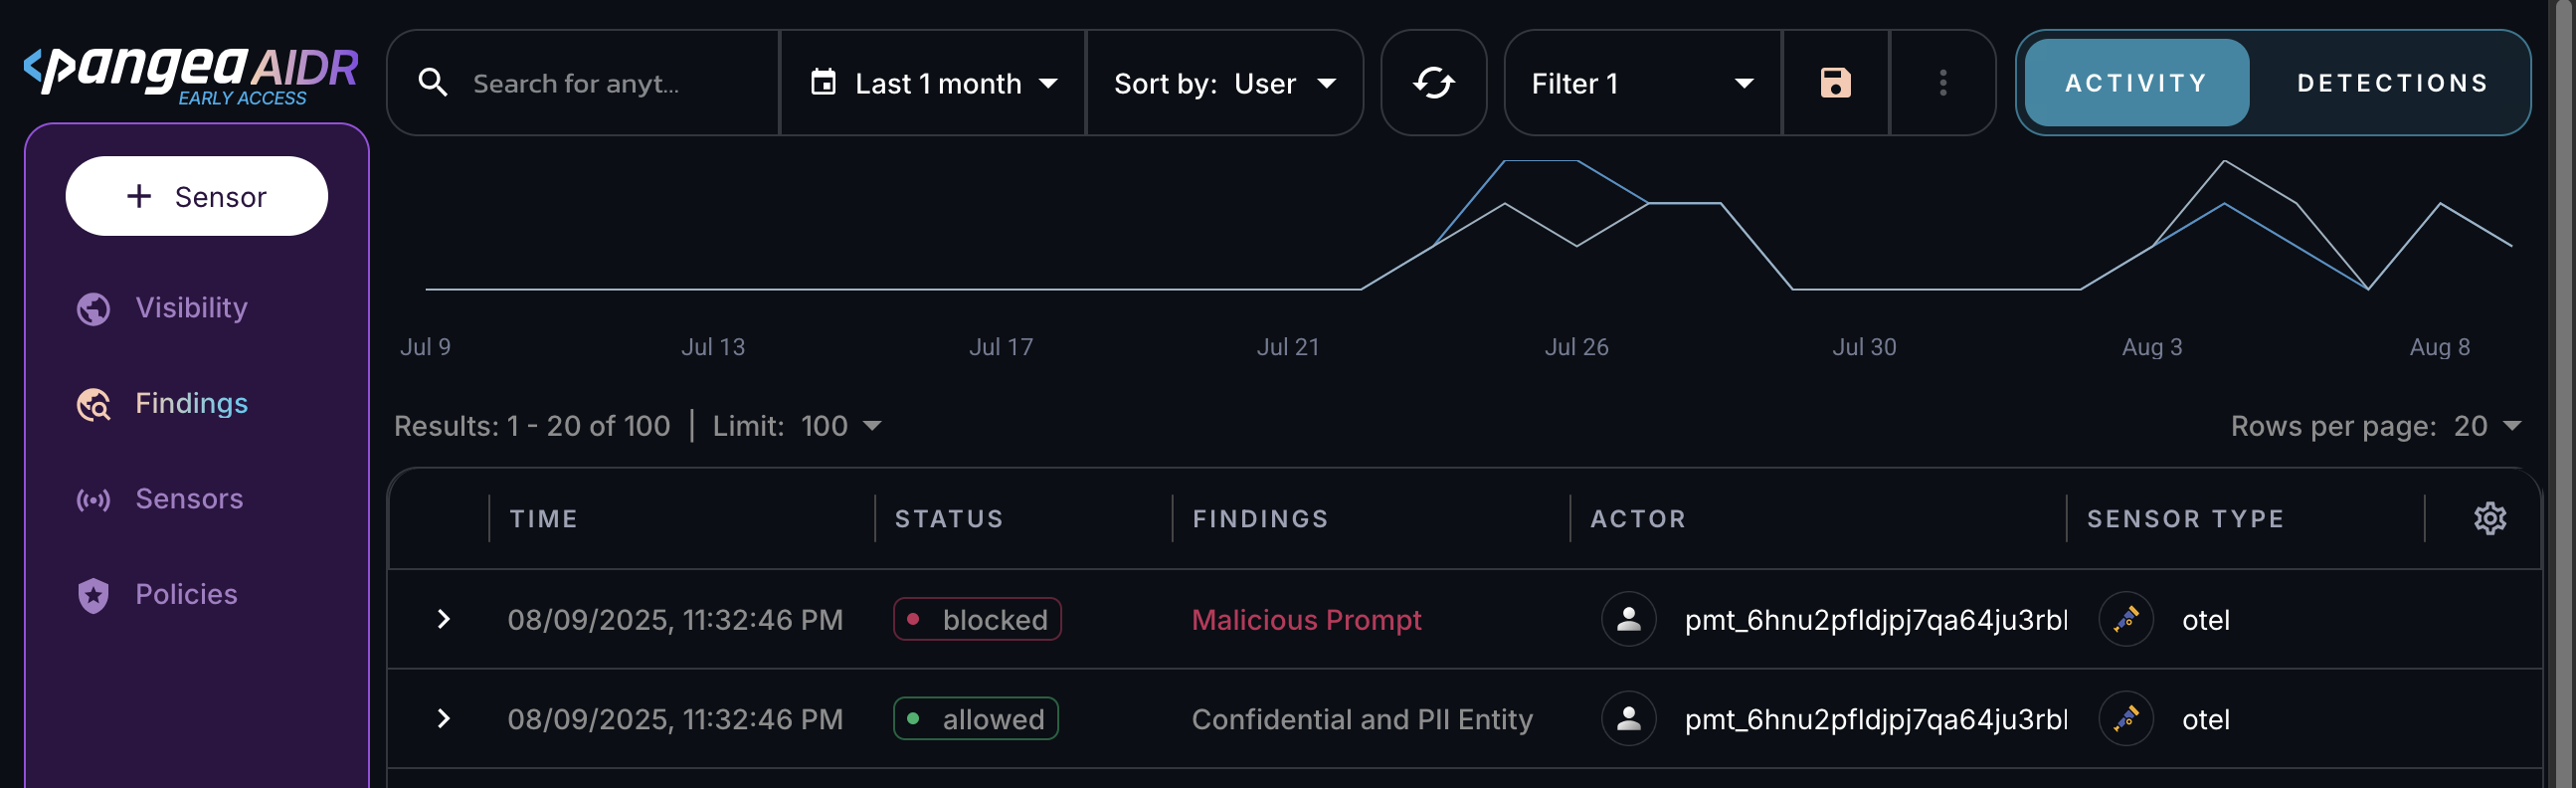
View sensor data in AIDR
Installing a sensor enables AIDR to collect AI data flow events for analysis.
All sensor activity is recorded in the Findings and Visibility pages, can be explored in AIDR dashboards, and may be forwarded to a SIEM system for further correlation and analysis .
Policy evaluation and detections
When the Browser Sensor sends captured AI activity to AIDR, any assigned input and output policies are evaluated, and the resulting detections are logged in AIDR for visibility, investigation, and integration with other security workflows.
Input policy rules (such as blocking or redacting sensitive data) are enforced directly in the browser, preventing the user from sending potentially harmful content to the AI provider.
Because the Browser Sensor cannot fully intercept and modify live responses, the results of applying output policy rules are recorded in the AIDR console but are not enforced on what is displayed in the browser, and the user will see the unmodified response from the AI provider.
Next steps
- View collected data on the Visibility and Findings pages in the AIDR console. Events are associated with applications, actors, providers, and other context fields - and may be visually linked using these attributes.
- On the Policies page in the AIDR console, configure access and prompt rules to align detection and enforcement with your organization’s AI usage guidelines.
Was this article helpful?