View Logs
Understand the features of Log Viewer
In the
Pangea User Console , under the COMPLIANCE section, click Secure Audit Logs, and select View Logs to open the Secure Audit Log Viewer.Secure Audit Log can automatically capture events in AI Guard , Prompt Guard , AuthN , AuthZ , Secure Share , and Vault . These logs, which by default are filtered by the service configuration ID, can be accessed by selecting Activity Log in the navigation sidebar on the respective service page in the Pangea User Console .
The Secure Audit Log Viewer page can be used to search, view, and verify tamperproofing of all logs stored by the service.
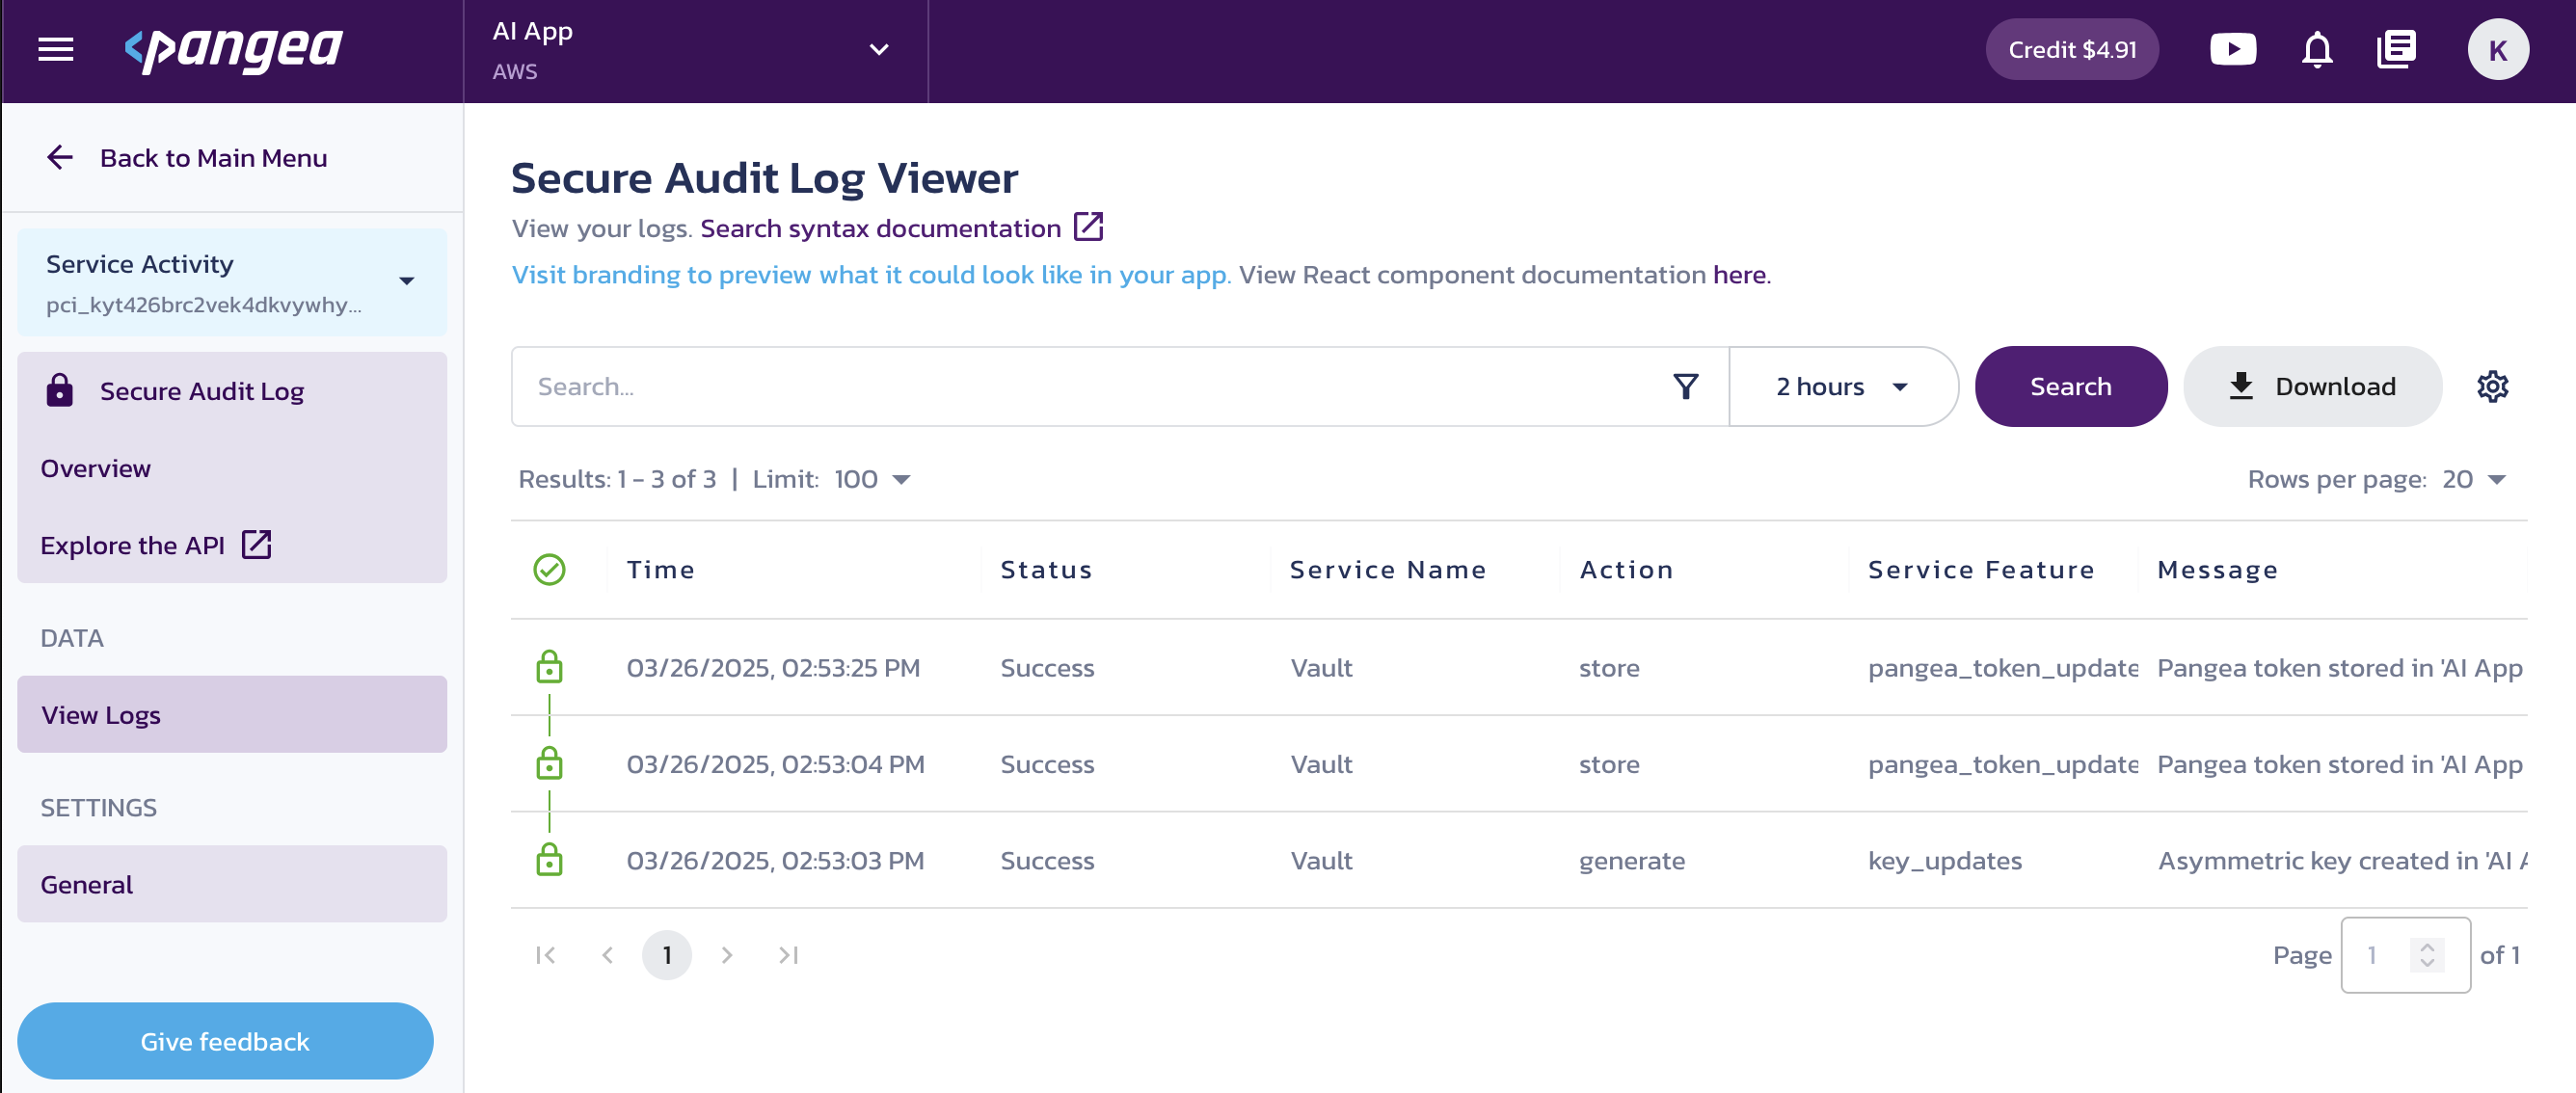
Search bar
By default, the log viewer displays events from the past two hours.
To customize your search:
- Click the funnel icon to open the filter dialog, enter your criteria, and click Search. The search syntax appears in the search bar, and matching results display in the table.
- Place your cursor in the search bar to view a dropdown of available search parameters. Start typing to filter the list and use autocompletion to build your query.
- Enter your query manually. For more information, see search syntax .
Date range
All searches must include a time range, with the default set to the most recent two hours.
The date range selector next to the search button provides several options:
- Quick selections - Select a relative range of 1, 7, or 30 days.
- Relative - Define a custom relative date range.
- Between - Search for log events between two specific dates.
- Before - Search for events that occurred before a specific date.
- After - Search for events that occurred after a specific date.
You can apply a time range filter directly from the log table.
Add a time field to the table columns, then hover over its value in a table row.
Click the plus icon (⊕) next to it to filter by that exact date or set it as a range boundary.
The log retention policy defines how long Pangea stores logs across different storage tiers and which logs remain searchable. For details, see the Secure Audit Log Retention policy documentation.
You can configure the Retention policy on the Secure Audit Log General Settings page in your Pangea User Console .
Results
Displayed fields
By default, the fields marked as Visible in the audit log schema are displayed as columns in the search results. To change which fields are displayed, click the gear button.
By default, the fields marked Visible in Settings >> Audit Log Schema will be displayed as columns in the search results. To display different fields, click the gear button.
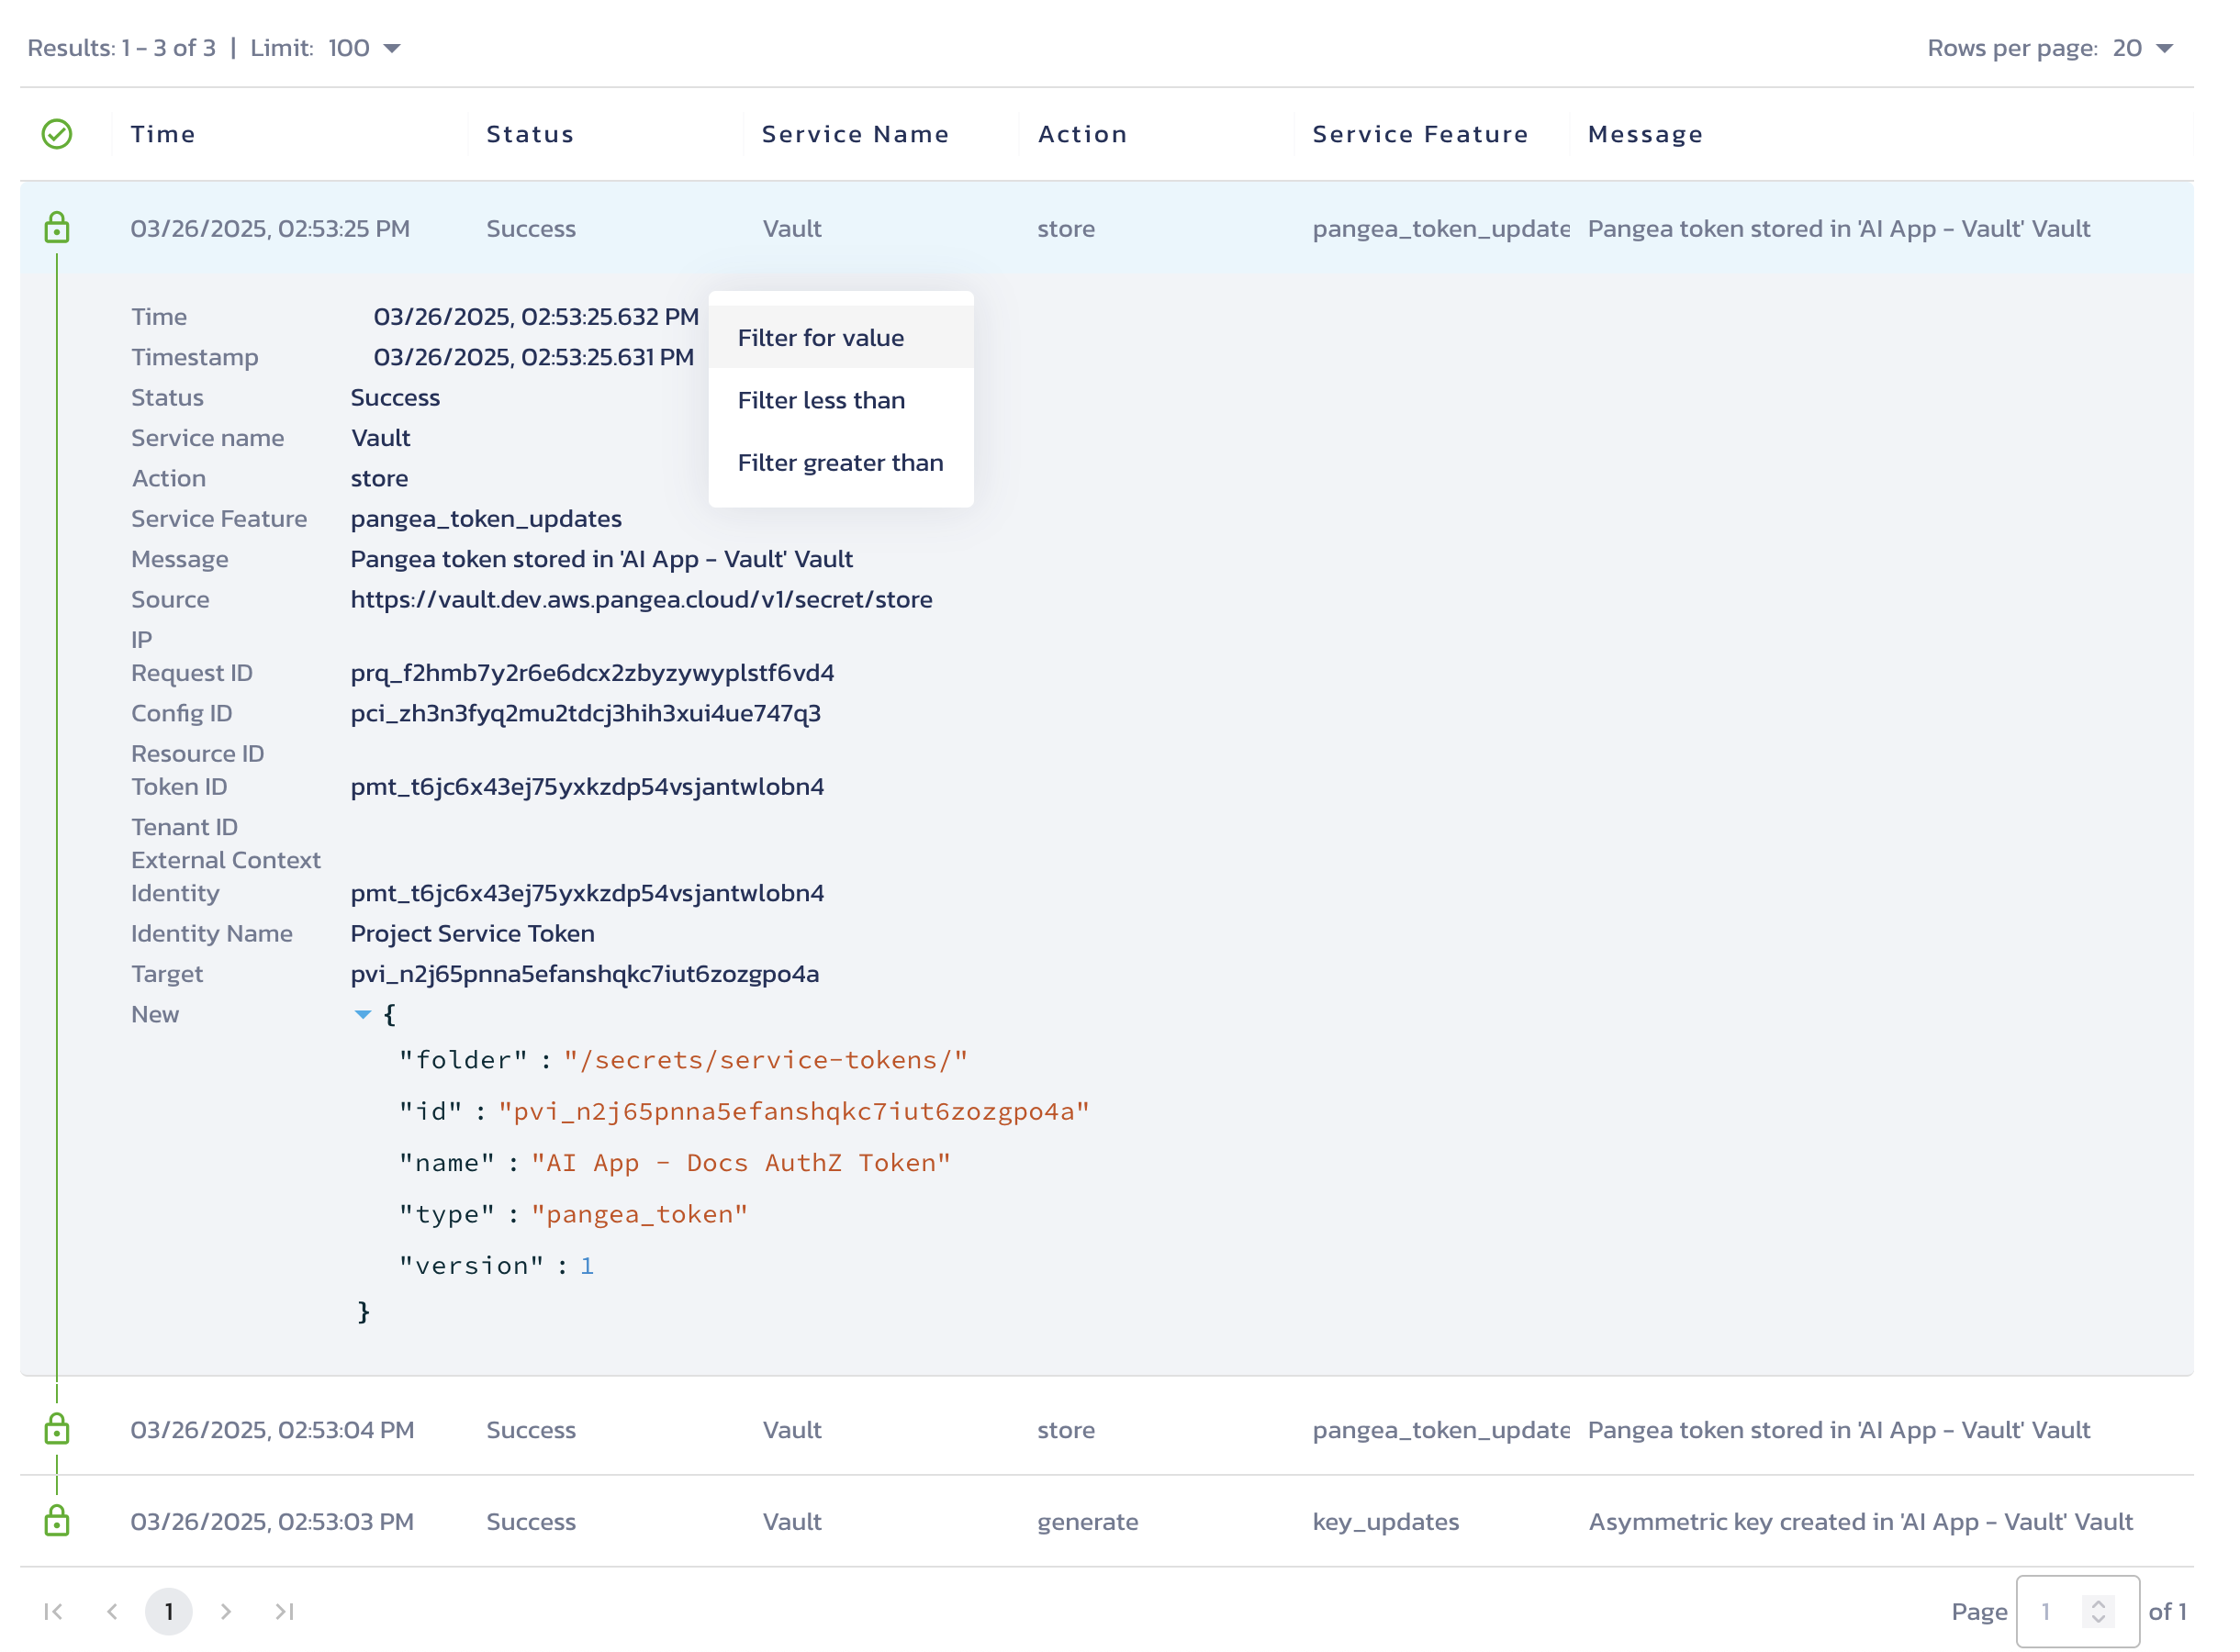
Event details
To view all fields for an event, click its row in the search results. The row expands to show every event field, including those not currently visible in the table.
If a field (such as Old or New) contains JSON data, it displays as an interactive JSON tree.
Field comparison
A common requirement for audit logs is to record the value of a field both before and after a change is made. This enables the history of values to be recorded when capturing the update events.
The log viewer highlights in yellow the differences between the values stored in the old and new fields.
Tamperproof information
Icons in the log viewer indicate tamperproof status for each record. Learn more about Tamperproofing in the Secure Audit Log documentation.
-
Lock icon
The lock icon shows that the membership proof for the log event is verified. Click the icon to open a pop-up with details for independently verifying the event:
-
Status - Possible statuses are Verified, Unverified, or Failed.
- Unverified - Indicates cached records that are not yet committed.
- Failed - Shows with a red lock icon.
-
Verification artifacts - Includes the message hash, membership proof, consistency proof, root hash, and a link to the published root hash.
-
Verification command - Provides a command you can run with Python SDK to verify the record's tamperproof status.
-
-
Green line
A vertical green line between lock icons indicates that the consistency proof for the two adjacent log events is verified.
Tamperproof icons appear asynchronously after search results return, as verification is performed.
Download logs
Use the Download button to save search results to a CSV file for analysis, sharing, archiving, importing into another audit logging service, or other purposes.
The download button may trigger a pop-up to verify that you want to download from the website. Some browsers block this pop-up, so you may need to allow pop-ups for the page. After that, you must confirm the download request before the download begins.
Was this article helpful?