Enable and Configure Secure Audit Log
Review the steps to enable the Secure Audit Log service and create its initial configuration
In the
Pangea User Console under the COMPLIANCE section, select Secure Audit Log. If the service has not been enabled, the configuration dialog will open.The configuration process will proceed through the following multi-stage modal:
Enable Secure Audit Log
When the service is enabled, as indicated by a green dot next to the service icon in the navigation sidebar, this dialog is omitted.
While enabling Secure Audit Log, you will create a new service configuration. You can update the default configuration name in the input field at the top of the dialog.
The dialog also provides information about the service and its capabilities.
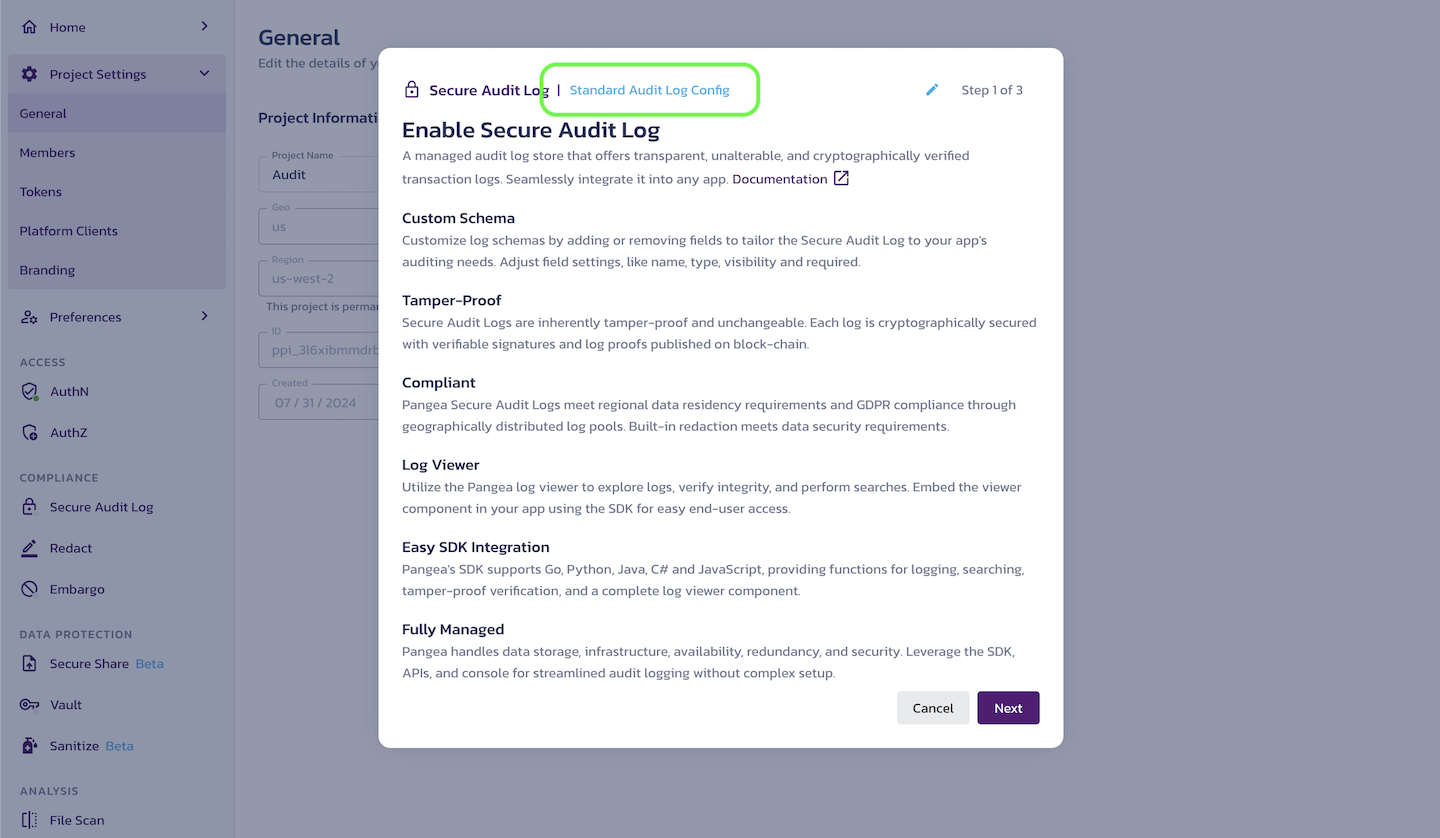
Click Next to proceed.
Audit Schema
Secure Audit Log saves the details of the auditable activity in log events. The fields of a log event are defined in the audit schema.
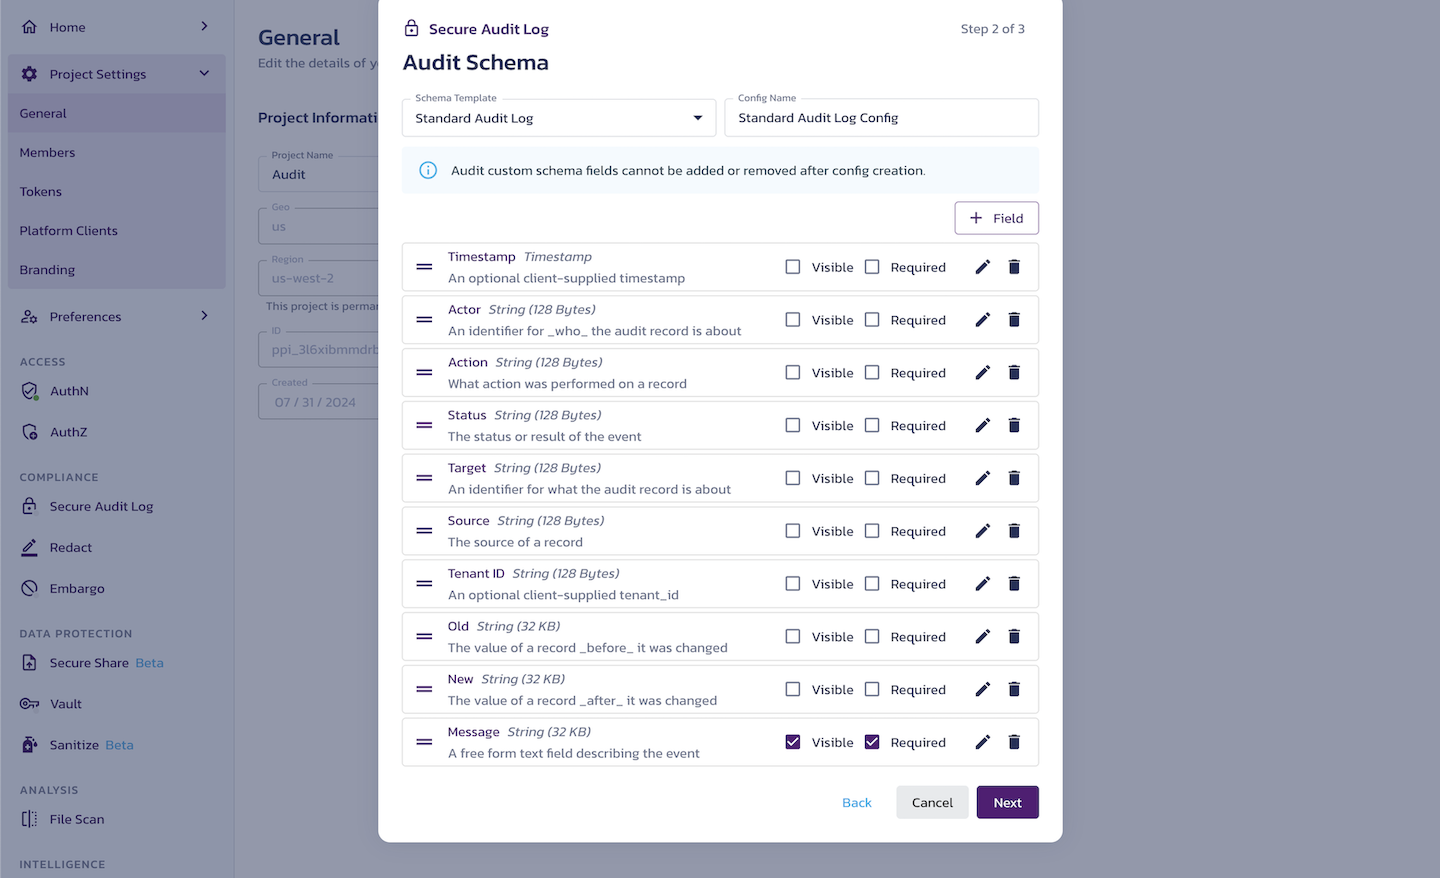
Schema Template
In the Schema Template drop-down, you can select a template for your schema and customize it by adding, removing, or modifying fields to create your custom schema. You can delete and add fields.
You can also change field visibility in the Log Viewer and whether the field is required. Note that at least one of the fields must be required.
You can rearrange the fields by dragging them using the handle on the left-hand side.
Based on your selection and the application needs, you can update the current configuration name in the Config Name input.
Events streamed from third-party vendors (such as Auth0) have predefined fields that cannot be added or removed from the log content.
Standard Audit Log template
The default Standard Audit Log schema template includes the following fields:
- Timestamp - An optional client-supplied timestamp. A Pangea-generated timestamp will always be provided with every log entry. This field is an optional client-supplied timestamp.
- Actor - An identifier for who the audit record is about. The actor field is used to record who performed a specific action. This could be used to record the user ID, username, first and last name, or a combination of fields.
- Action - The action performed on a record. This is used to record the action that occurred. Typical values seen in this field are "Create/Read/Update/Delete," but actions specific to your application could also be included.
- Status - The status or result of the event. Status is used to record whether or not the action was successful.
- Target - An identifier for what the audit record is about. This is used to record the specific record that was targeted by the recorded action. This could be an object ID, a username, or other identifying information.
- Source - The source of a record. The source field is for recording from where an activity occurred. This could be used to record a client's IP address, country of origin, the application used, etc.
- Tenant ID - An optional client-supplied tenant ID.
- Old - The value of a record before it was changed. This is usually used in combination with "new-value." Old-value is used to record the value(s) of a record before any change made by the recorded action. If JSON is provided, the log viewer will render this field as JSON.
- New - The value of a record after it was changed. Used in combination with "old," new is used to record the value(s) of a record after a change has been made by the recorded action. If JSON is provided, the log viewer will render this field as JSON.
- Message - A free-form text field describing the event. This field is used to record a detailed account of what action occurred. This can be recorded as free-form text or as a JSON field. If JSON is provided the log viewer will render this field as JSON.
Determine audit fields
When determining which fields to use, developers should consider the use case and search requirements. For instance, if there is a requirement to return all actions initiated by a specific user, using the actor field would search and sorting much easier. If searching for events by the type of activity that occurred (for example, Create, Update, Delete) is important then Action may be a useful field to record.
These options are designed to provide distinct fields to make sorting and searching for specific details easier based on the audit requirements.
The event fields in use can be changed at any time. The recommended practice is to use as many optional fields as reasonably possible for the use case. It's easier to reduce the number of fields used rather than trying to add new fields later.
Adding new field
To add a new audit field, click + Field, which opens the Edit Audit Field form. Fill out the following entries in the form:
- Name - Enter the name of the audit field using lowercase letters.
- Display name - This field is auto-generated from the Name field.
- Type - Select a data type from the drop-down menu based on your field information. Note that the String data types have size limits associated with them.
- Description - Enter text to describe the field.
- Visible in table - Check this box if you want the field to be displayed as a column by default in the audit log viewer.
- Required - Check this box if this field is required during logging.
Click Save.
- Once you've created your audit log configuration, you cannot change the schema. To use a different schema, you must create a new configuration.
- When creating a new schema, you can define all fields and their properties, including field names.
- After creating the schema, you can modify the visibility and order of fields, specify whether they are required, and update the fields' descriptions.
Click Next.
Create a token
Create a new token
In the dialog, you can Create a new token for your new Secure Audit Log service configuration.
For the new token, you can update the Token name and set the Expiration Date.
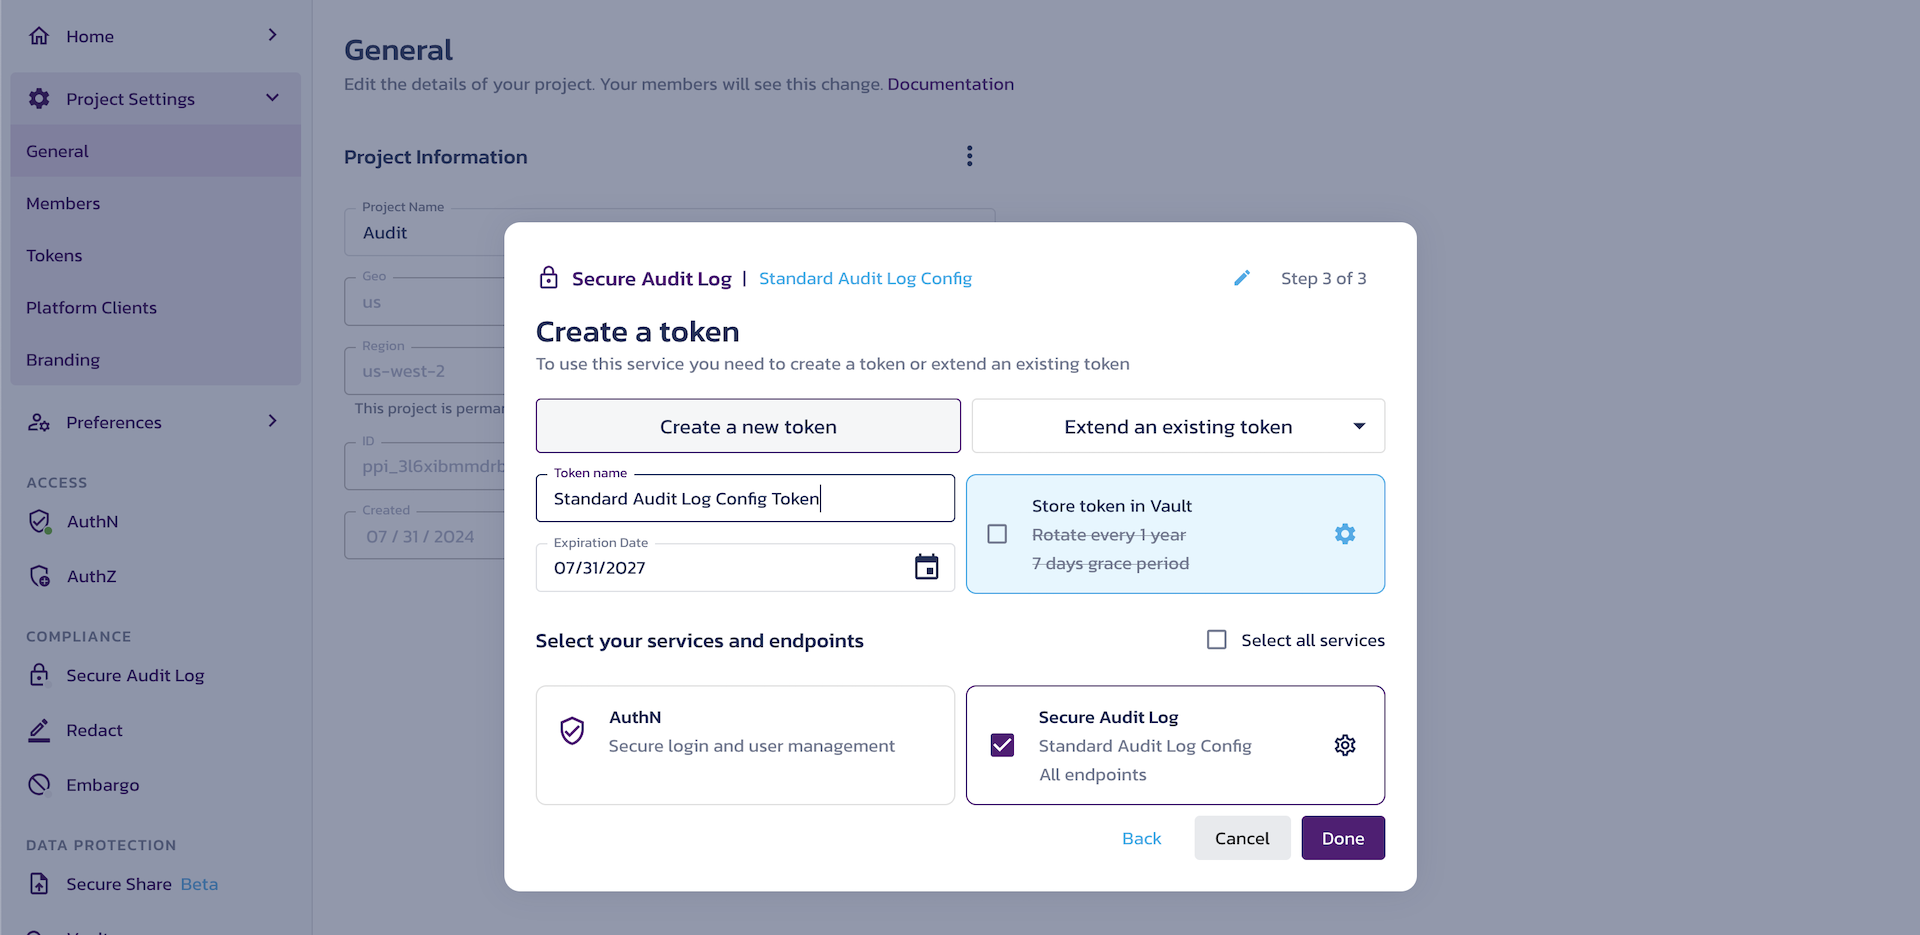
Extend an existing token
If you have existing tokens in your Pangea project, whether created explicitly or as part of enabling a service, you will see the Extend an existing token choice. In the Extend an existing token drop-down, you can select an existing token and grant it access to your new configuration.
Note that when you enable a service, it automatically creates a Secure Audit Log configuration for capturing service events, along with a Service Activity Read Token. This token is typically used to read from the Service Activity configuration.
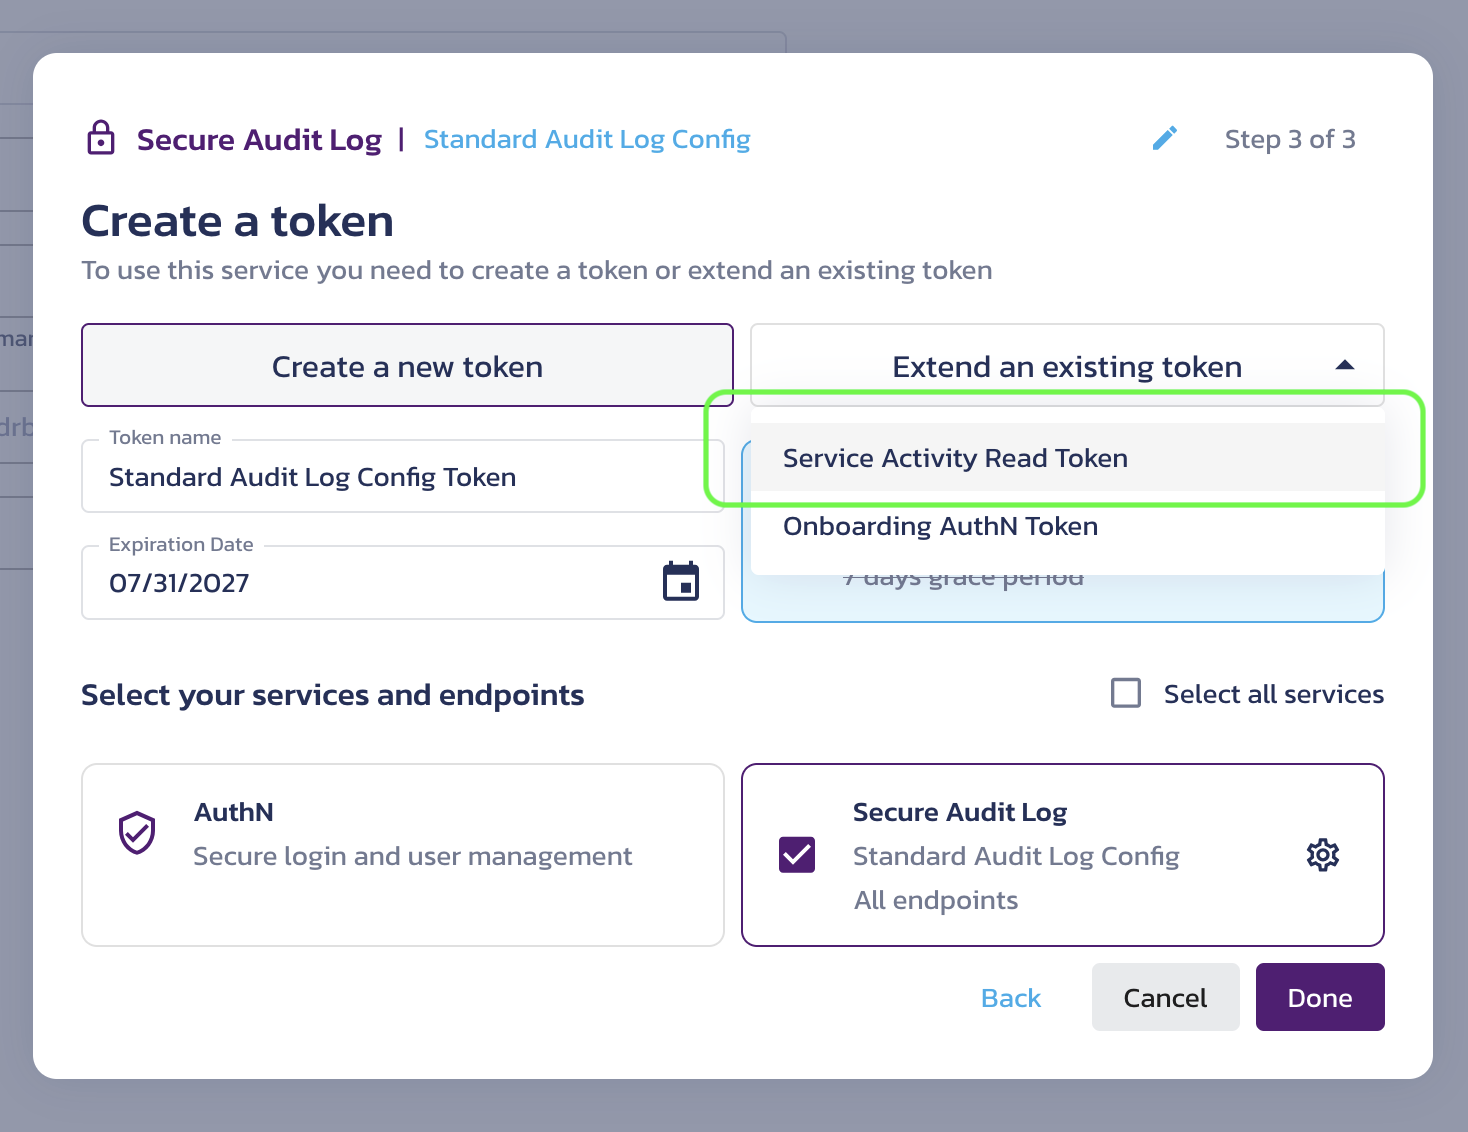
Create a token dialog - extend an existing Secure Audit Log token
As an example, selecting this option will extend an existing token already associated with a Secure Audit Log configuration, resulting in a token with access to Multiple Configurations.
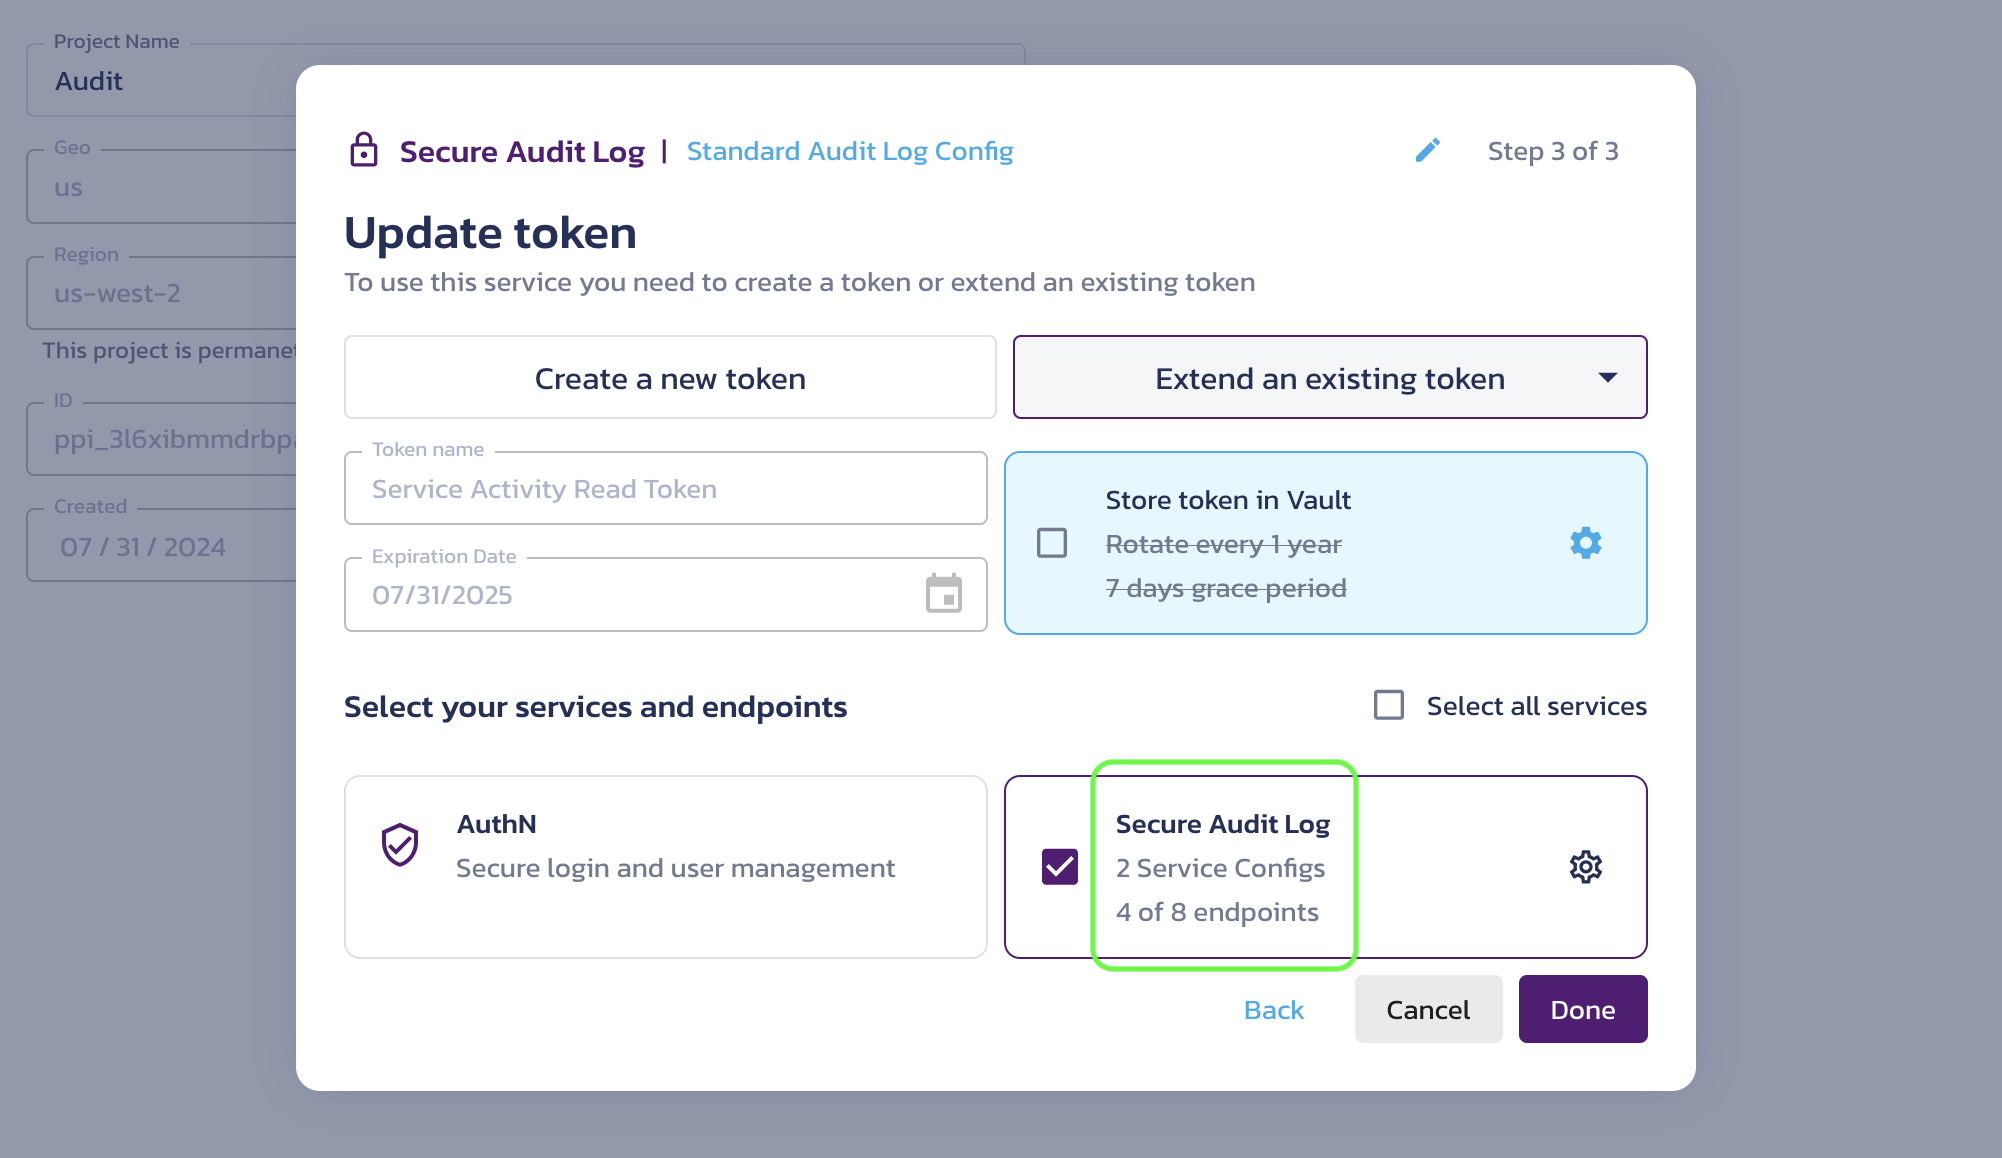
Create a token dialog - an existing Secure Audit Log token extended
If you use the same token for multiple service configurations, the token alone is not sufficient to determine which configuration you are requesting. In this case, you MUST specify a configuration ID when calling the service APIs. Otherwise, you will receive an AmbiguousConfigID error.
Tokens are used as bearer tokens to authenticate access to Pangea services. They are provisioned per project and can be assigned scopes that provide specific access to each Pangea service. Pangea recommends limiting token scopes to only those required by the application using the tokens.
Customize token
Optionally, you can:
-
Store your token in Vault.
-
Associate your token with other services and configurations, and limit its access to specific endpoints and fields.
Click the gear icon next to the selected service to access the Manage Endpoint Access, Manage Config Access, and Manage Field Restrictions dialogs.
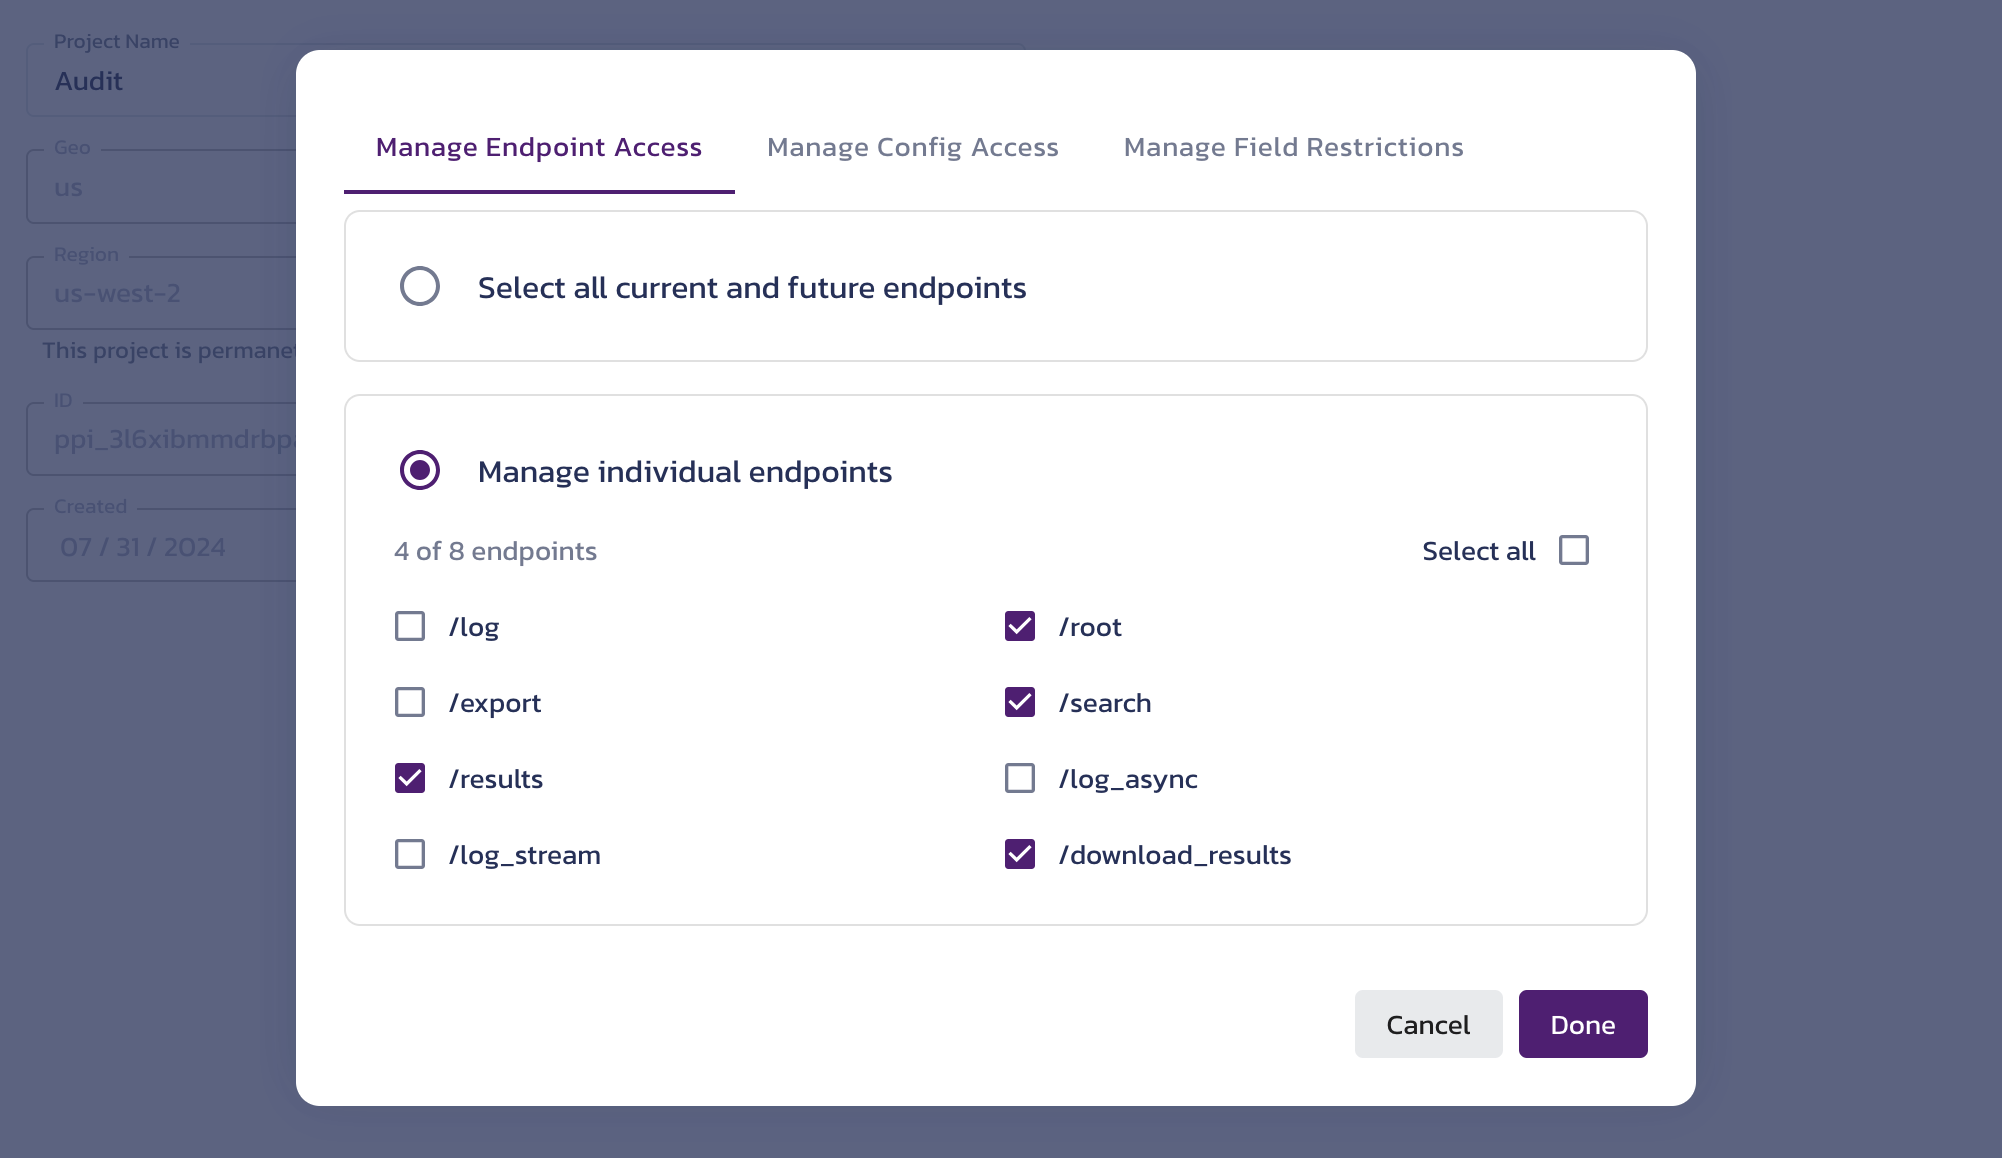
Create a token dialog - endpoint access details note:By default, the Service Activity Read Token (used here as an example) is granted access only to read endpoints and cannot be used to save log events. If you extend an existing token, check its current configuration and modify it as necessary, or create a new token to ensure it works as intended in your application.
In the Manage Config Access dialog, you can again associate your token with other service configurations. This includes existing Secure Audit Log configurations. In such cases, you will be creating a token with access to Multiple Configurations.
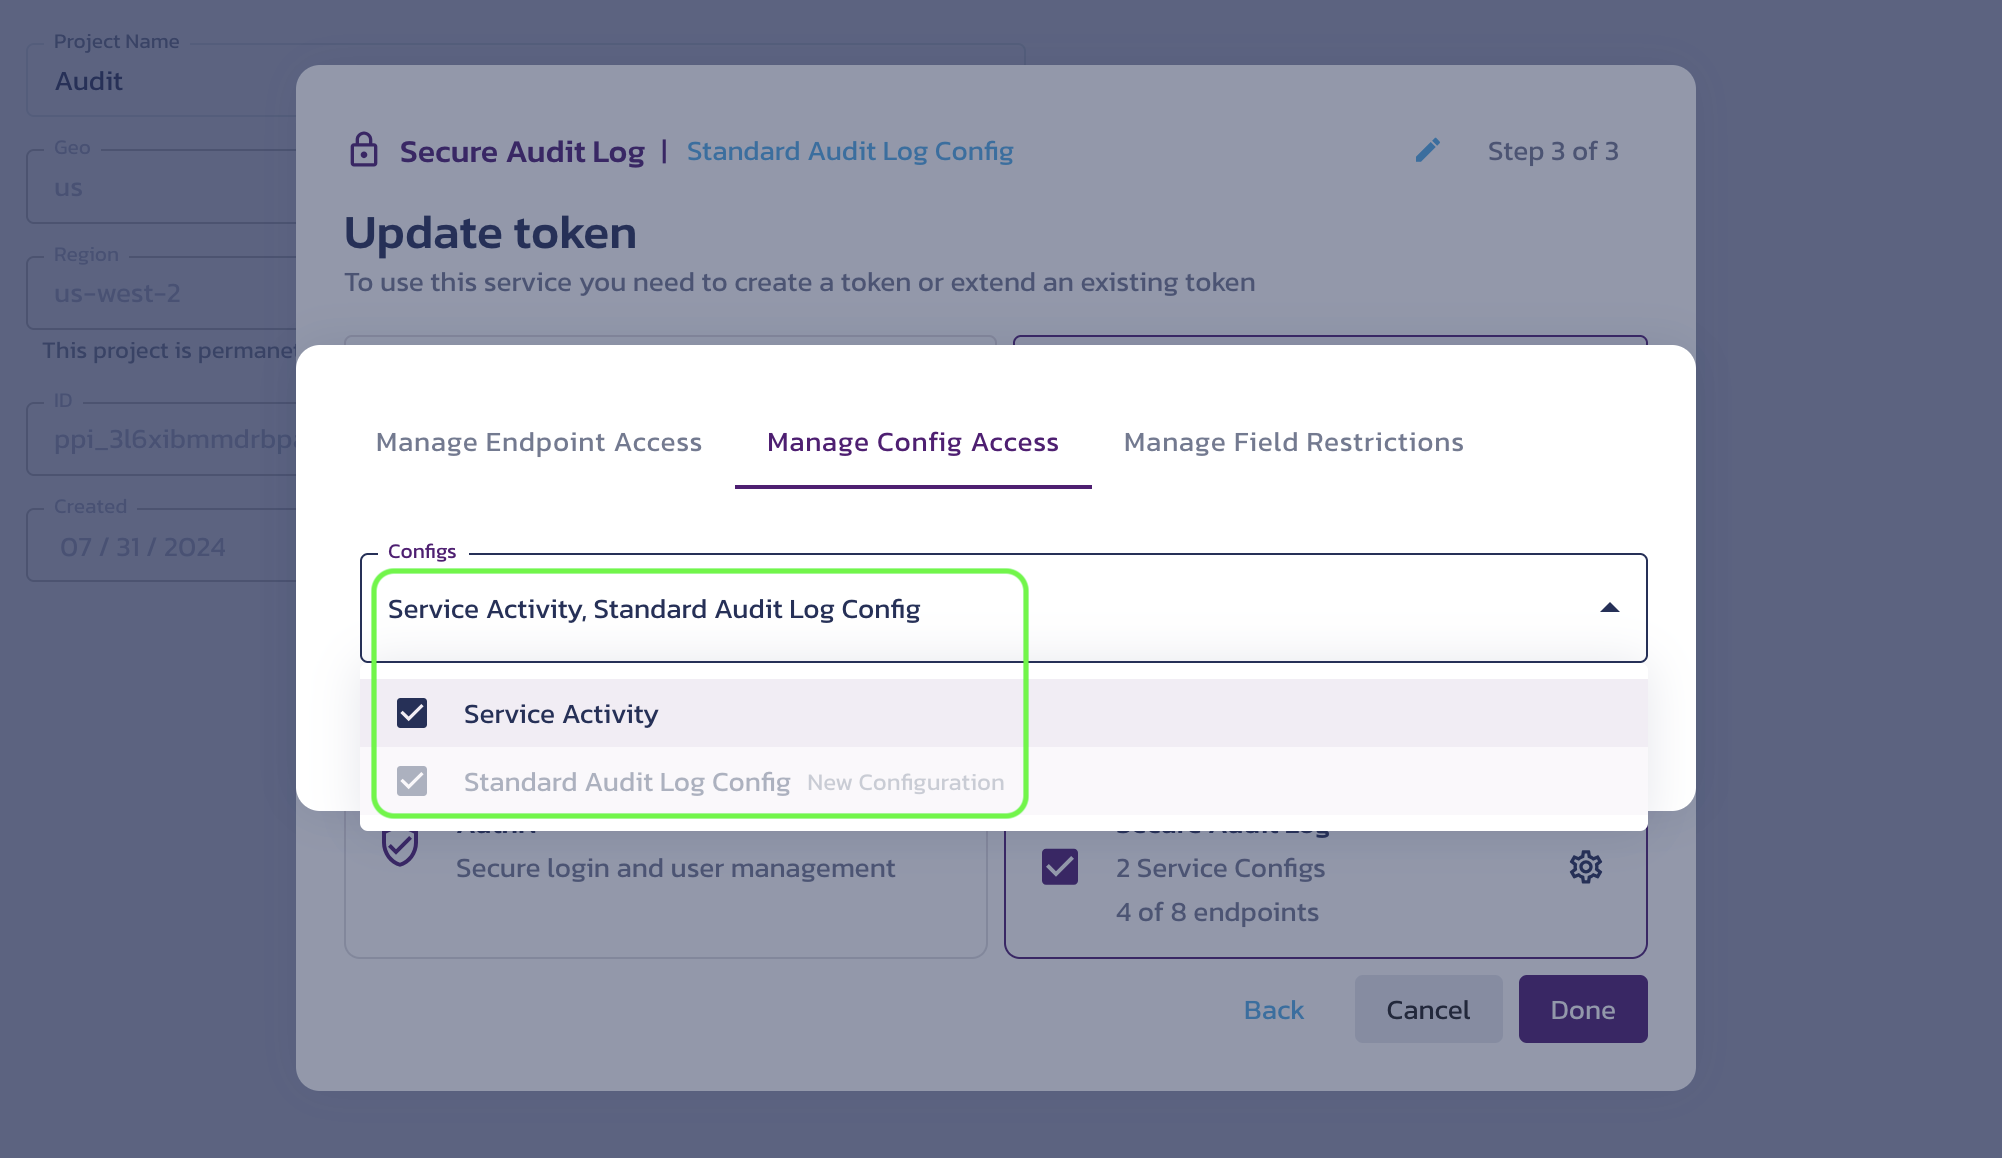
Create a token dialog - config access details warning:If you use the same token for multiple service configurations, the token alone is not sufficient to determine which configuration you are requesting. In this case, you MUST specify a configuration ID when calling the service APIs. Otherwise, you will receive an
AmbiguousConfigIDerror.
Click Done to save the configuration.
Log an event
In the next dialog, you can view example syntax for making requests to the Secure Audit Log APIs.
Optionally, you can click Send to save your first log event in the new configuration.
Click Finish.
Select View Logs in the left-hand sidebar to see your log event. Hover over each field to read its description.
Was this article helpful?