General Settings
Learn how to define the Retention policy, integrate with the Redact service, configure the Audit Schema, and forward log events.
In the Pangea User Console under COMPLIANCE section, select Secure Audit Log and click
Settings .Retention policy
The retention policy settings determine how long audit data will be kept. Log data that has expired and exceeded the retention period cannot be recovered. Ensure your retention policy aligns with your specific needs.
The Secure Audit Log data can be stored in different tiers, each with its own retention policy:
- Hot - Optimized for search performance. Retained for up to 14 days.
- Warm - Allows search and export, optimized for cost. Retained for up to 10 years.
- Cold - Archived data, retrievable only by request. Learn how to make a request in the Cold Export documentation. Retained for up to 10 years.

Set the retention policy for a Secure Audit Log configuration
Ingested logs are first stored in hot searchable storage for the duration of the configured hot retention window. After that, they move to warm searchable storage for the configured warm retention period. Once the warm period ends, logs are moved to cold storage.
Change the retention policy by updating the unit type and corresponding units to meet your requirements within the allowable limits. Depending on the storage type, you can specify the retention policy periods in Days, Weeks, Months, or Years.
You might need to update an old audit configuration to enable tiers in the Secure Audit Log retention policy.

Update a Secure Audit Log configuration to enable Hot, Warm, and Cold tiers in the retention policy settings
In the legacy configurations, the retention policy is determined by the fields appearing after the text Retain audit data for.
Redact log events
The Pangea Redact service integrates with the Pangea Secure Audit log. This integration should be used as a fail-safe measure to prevent the unintentional proliferation of sensitive data within your audit logs.
Generally, we recommend omitting personally identifying information or secrets from secure audit logs unless they are protected by redaction.
After enabling the Redact service, you can enable the Redact records option under the Secure Audit Log Settings in the Pangea User Console. Once enabled, select a Redact configuration to use and the audit fields to be redacted. Click Save to apply your selection. The number of applied redaction rules will be displayed in the Redact records item under Secure Audit Log Settings.
To modify the Redact service configuration, click the Configure redaction rules link. Learn more about configuring the redaction rules in the Redact Configuration docs.

If you're integrating the Secure Audit Log and Redact service into your app, the Redact service will, by default, only redact the message, old, and new fields. Review the other parameters, such as actor, available for redaction, as they may be relevant to your use case.
You can unredact log events that were redacted with Format Preserving Encryption (FPE) by using the Redact /v1/unredact and /v1/unredact_events endpoints.
Log Signing
Log signing allows you to cryptographically sign a log record for assurance that the content of the log entry has not been modified since created. Logs can also be signed on by the client using the SDK with your own keys that are not provided to Pangea.
To turn on the Log Signing, click the toggle to the enabled position. If the Log Signing service has not been enabled in your project, the enablement modal will appear.
Click Enable to enable the Vault Service. To connect a signing key with Secure Audit Log the Vault service must be enabled first. Now, click Configure a signing key to choose one of the following:
-
Pangea generated - Let Pangea generate the key material for you.
-
Import a key - Bring your own key.
Click Save.
Audit Log Schema
You can view the schema defined for the currently selected audit log configuration. The fields for this schema appear on the right side of the page.
You can adjust a field description, its visibility in the Log Viewer , and whether the field is required.
By following the Create new configuration link, you can create additional configurations .
Audit Log Forwarding
You can configure event logs to be forwarded to an external data repository using the HTTP Event Collector (HEC) protocol. This enables you to consolidate logs collected by Pangea with your existing data for centralized analysis and reporting.
CrowdStrike (Next-Gen SIEM)
Configure a connector
In your CrowdStrike Falcon console, follow the instructions in Step 1: Configure and activate the Pangea AI Guard data connector in the
HEC/HTTP Event Connector guide.For example:
-
Navigate to the Data connections page under Next-Gen SIEM >> Data onboarding in your CrowdStrike Falcon console.
-
Click Add connection in the list of connections.
-
In the Product filter, select HEC.
-
Click HEC / HTTP Event Connector in the list.
-
Click Configure.
-
On the Add new connector page, enter Data source, Connector name, and Description.
-
Under Parser details, select a parser.
Pangea offers a CrowdStrike Next-Gen SIEM parser designed to process events from the AI Guard Activity Log , which is enabled by default when the AI Guard service is activated.
Select PangeaAIGuardParser if you're forwarding AI Guard activity logs to CrowdStrike.
-
Accept the terms and conditions, then click Save.
-
On the connector details page, click Generate API key.
-
Copy the API key and API URL. You will use these values to configure log forwarding in the Secure Audit Log service.
Set up log forwarding
-
Select an audit schema.
On the Secure Audit Log service page in your Pangea User Console , use the schema selector in the top-left to choose the configuration that matches your CrowdStrike parser.
To forward AI Guard activity logs, select
AI Activity Audit Log Schema. -
Click General in the sidebar to open the settings for the selected schema.
-
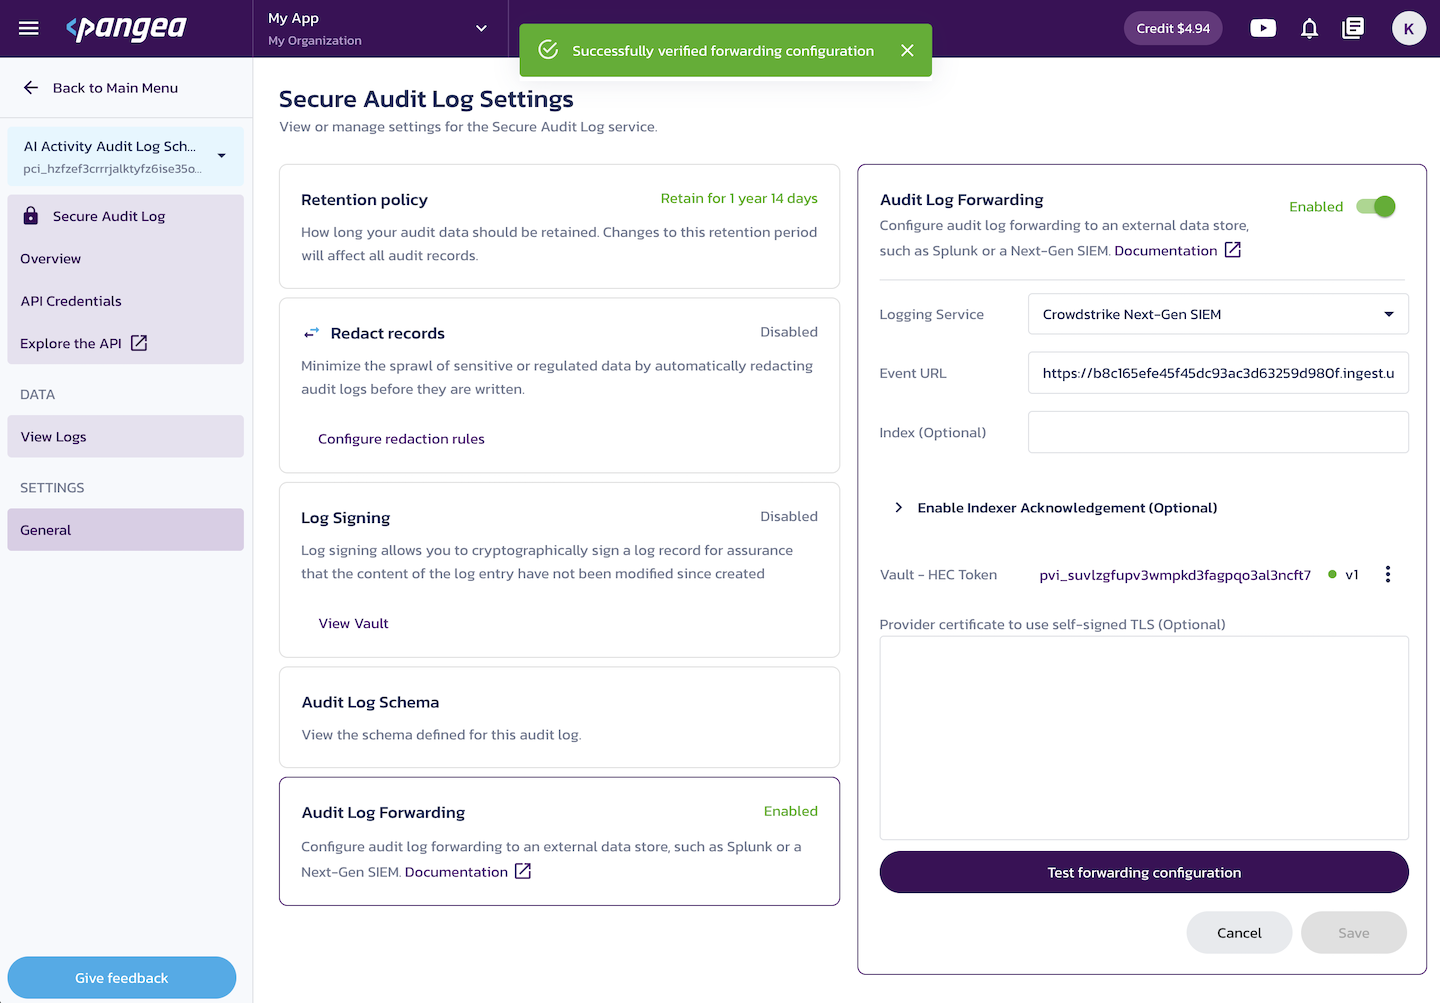
Under Audit Log Forwarding, toggle the control in the top-right to Enabled.
-
Set Logging Service to CrowdStrike Next-Gen SIEM.
-
For Event URL, enter the API URL from your CrowdStrike connector.
-
Click the Store HEC Token button.
-
In the New Secret dialog, enter the API key from your CrowdStrike connector in the Secret field.
-
Click Done.
-
Click Save to apply the configuration.
-
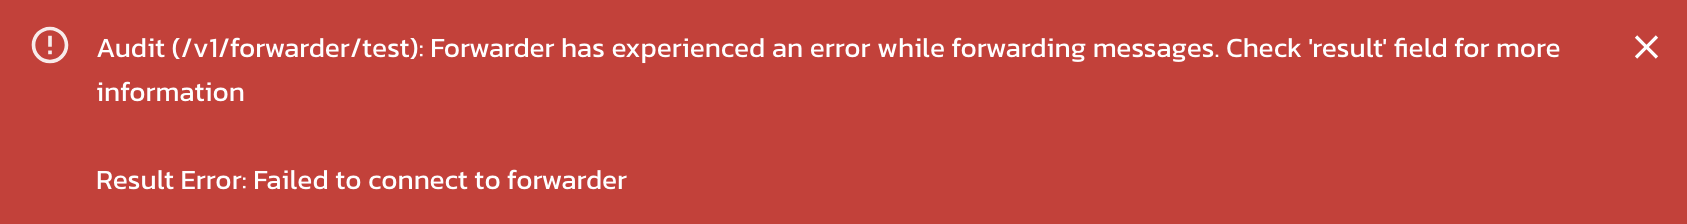
Click Test forwarding configuration to validate the setup.
A failed test displays an error message, for example:
To generate real events, return to the service list, open the AI Guard service page, and under Recipes, use the Sandbox feature to send a sample input.
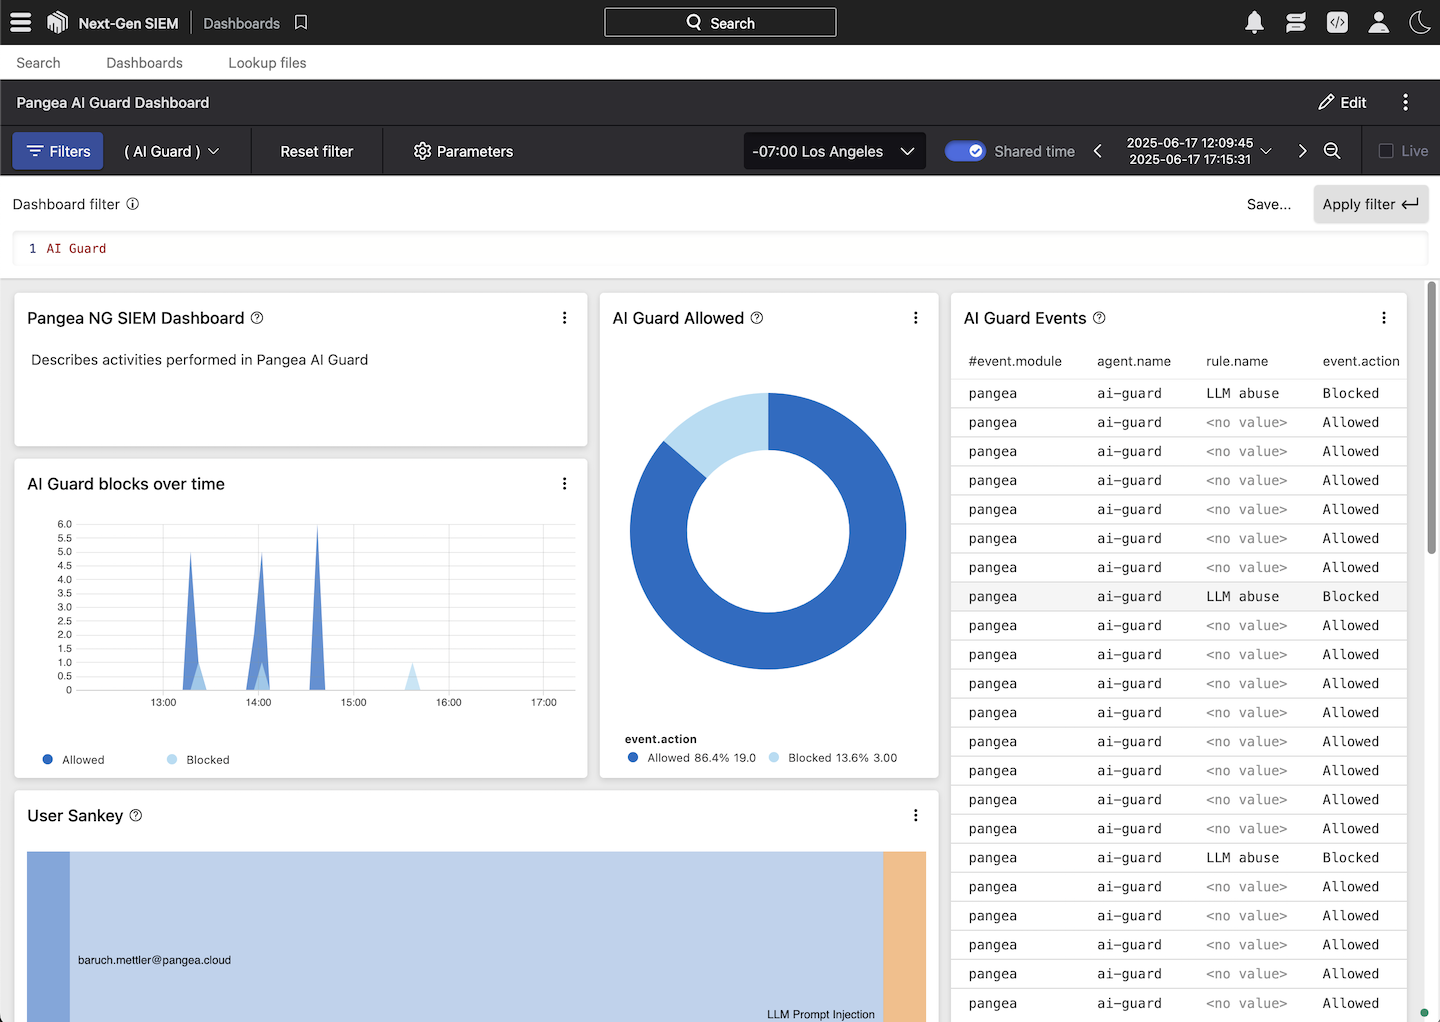
After a few minutes, you should see the forwarded events in your CrowdStrike Falcon console under Next-Gen SIEM >> Advanced event search.
The following optional fields are not applicable when using the CrowdStrike Next-Gen SIEM connector:
- Index
- Indexer Acknowledgment
- Provider certificate to use self-signed TLS
Next steps
To visualize log data forwarded from Pangea to CrowdStrike Next-Gen SIEM, use the prebuilt Pangea dashboards available on GitHub . You can import these dashboards into your CrowdStrike Falcon console by following the instructions in the repository README.
Splunk
Enable HTTP Event Collector in Splunk Web
Use the following resources to assist with the HTTP Event Collector (HEC) setup:
Set up log forwarding
-
Select an audit schema.
On the Secure Audit Log service page in your Pangea User Console , use the schema selector in the top-left to choose the configuration you want to forward to Splunk.
-
Click General in the sidebar to open the settings for the selected schema.
-
Under Audit Log Forwarding, toggle the control in the top-right to Enabled.
-
Set Logging Service to Splunk.
-
For Event URL, enter the full URL for sending events (e.g.,
https://<myhost>.<tld>/services/collector/event). -
(Optional) In the Index field, specify the Splunk index to include in the HEC payload. This can also be set in the HEC token settings.
-
(Optional) Configure Enable Indexer Acknowledgment only if this feature is enabled in your Splunk HEC settings:
- Acknowledge URL – The URL used for acknowledgment verification, typically in the format
https://<myhost>.<tld>/services/collector/ack. - Channel ID – Required for indexer acknowledgment. Generate a value using
uuidgenor a similar tool.
- Acknowledge URL – The URL used for acknowledgment verification, typically in the format
-
Click the Store HEC Token button.
- In the New Secret dialog, enter the HEC token from your Splunk setup in the Secret field.
- Click Done.
-
(Optional) In the Provider certificate to use self-signed TLS input, upload the public certificate of your private CA if you're using a self-signed or privately issued TLS certificate. This is not required if the certificate is issued by a trusted public Certificate Authority (CA).
-
Click Save to apply the configuration.
-
Click Test forwarding configuration to validate the setup.
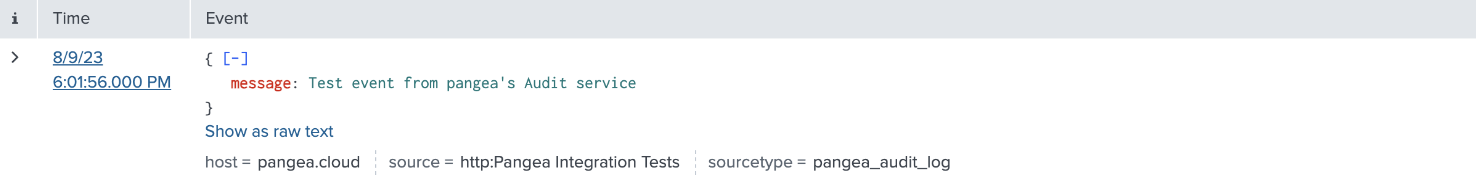
If successful, the following message will appear:

In Splunk, you should see a message forwarded by the Secure Audit Log service:
If the configuration test fails, an error message will appear at the top of the screen. For example, the following message indicates a certificate misconfiguration:

Was this article helpful?